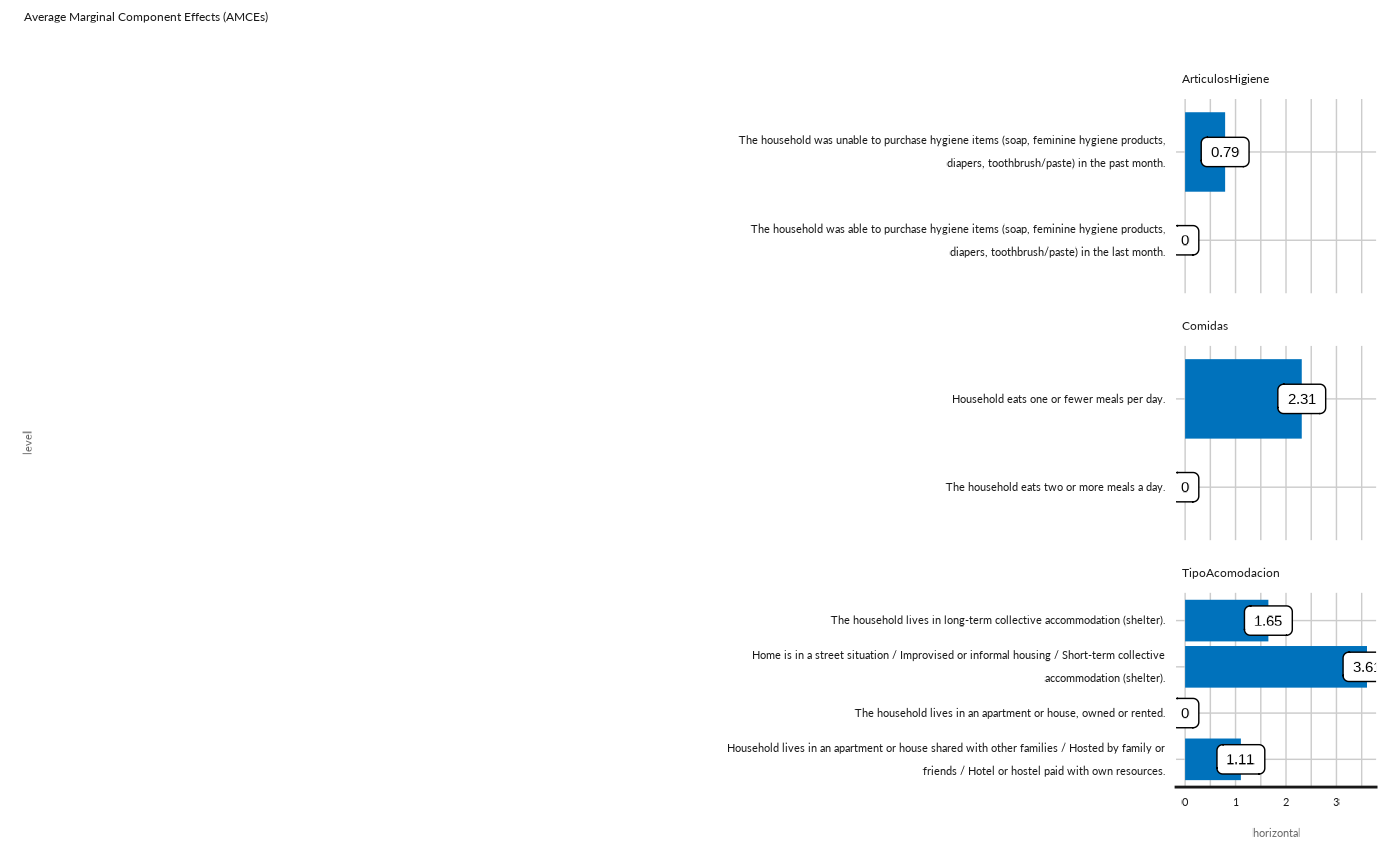
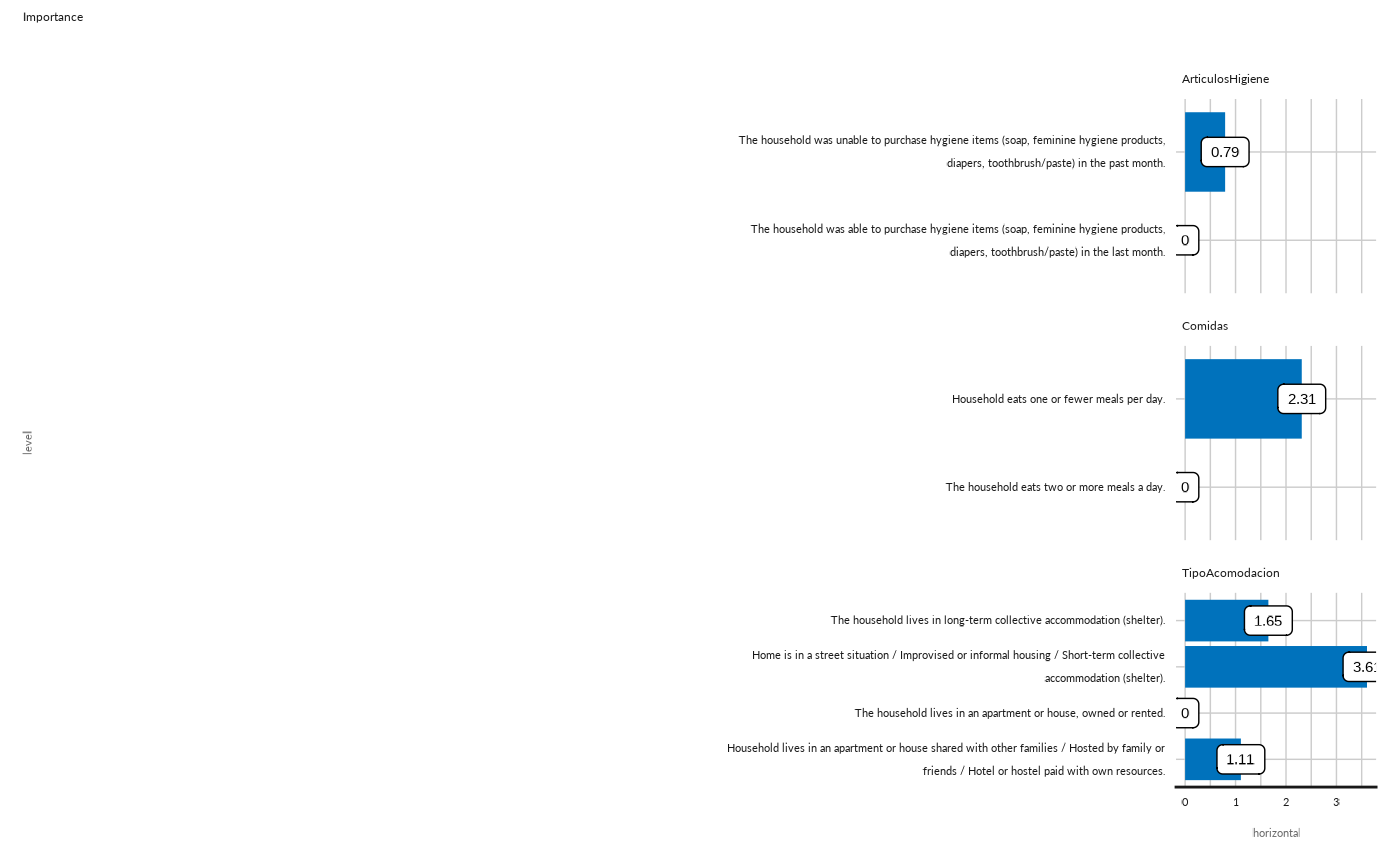
Plot results per dimension - Average Marginal Component Effects (AMCEs)
Examples
kobodata <-  system.file("data-demo/conjoint_data.xlsx", package = "VulnerabilityScoreCalibration")
koboform <-  system.file("data-demo/conjoint_form.xlsx", package = "VulnerabilityScoreCalibration")

cj <- conjoint_review(kobodata, koboform)
#> New names:
#> • `` -> `...1`
#> • `` -> `...2`
#> • `` -> `...3`
#> Warning: There were 12 warnings in `dplyr::mutate()`.
#> The first warning was:
#> ℹ In argument: `margins = list(cregg::mm(data, stats::as.formula(formula), id =
#>   ~email))`.
#> ℹ In row 1.
#> Caused by warning in `logLik.svyglm()`:
#> ! svyglm not fitted by maximum likelihood.
#> ℹ Run `dplyr::last_dplyr_warnings()` to see the 11 remaining warnings.

## Plot AMCES as bar for dimension 2
conjoint_plot_bar( as.data.frame(cj[["cjdata"]][2,][["amces"]])) +
  ggplot2::labs( subtitle = "Average Marginal Component Effects (AMCEs)")


## Plot importance as bar for dimension 2
conjoint_plot_bar( as.data.frame(cj[["cjdata"]][2,][["importance"]])) +
  ggplot2::labs( subtitle = "Importance")
