How much indicators evolve over time against thresholds?
Usage
show_indicators(
  year,
  programme_lab = NULL,
  iati_identifier_ops = NULL,
  ctr_name = NULL,
  result_type_name = "Outcome",
  type = "deviation"
)
Arguments
- year
A numeric value or a vector of numeric value to filter on year. Note that data pre-2022 are using a different set of indicators
- programme_lab
A character vector corresponding to the name of the programme.
- iati_identifier_ops
A character vector corresponding to the name of the operation.
- ctr_name
A character vector corresponding to the name of the country.
- result_type_name
either "Impact" "Outcome" "Output" - default is "Outcome"
- type
either "deviation" , "progress" or "gap" "deviation" showing Relative distances between target and actual - or "progress" showing Relative distances between baseline and actual - or "gap" showing Relative distances between green acceptable threshold and actual. gap analysis is only displayed for outcome indicators published after 2022
Examples
show_indicators(year = 2022,
ctr_name = "Brazil",
result_type_name = "Outcome",
type = "deviation"
)
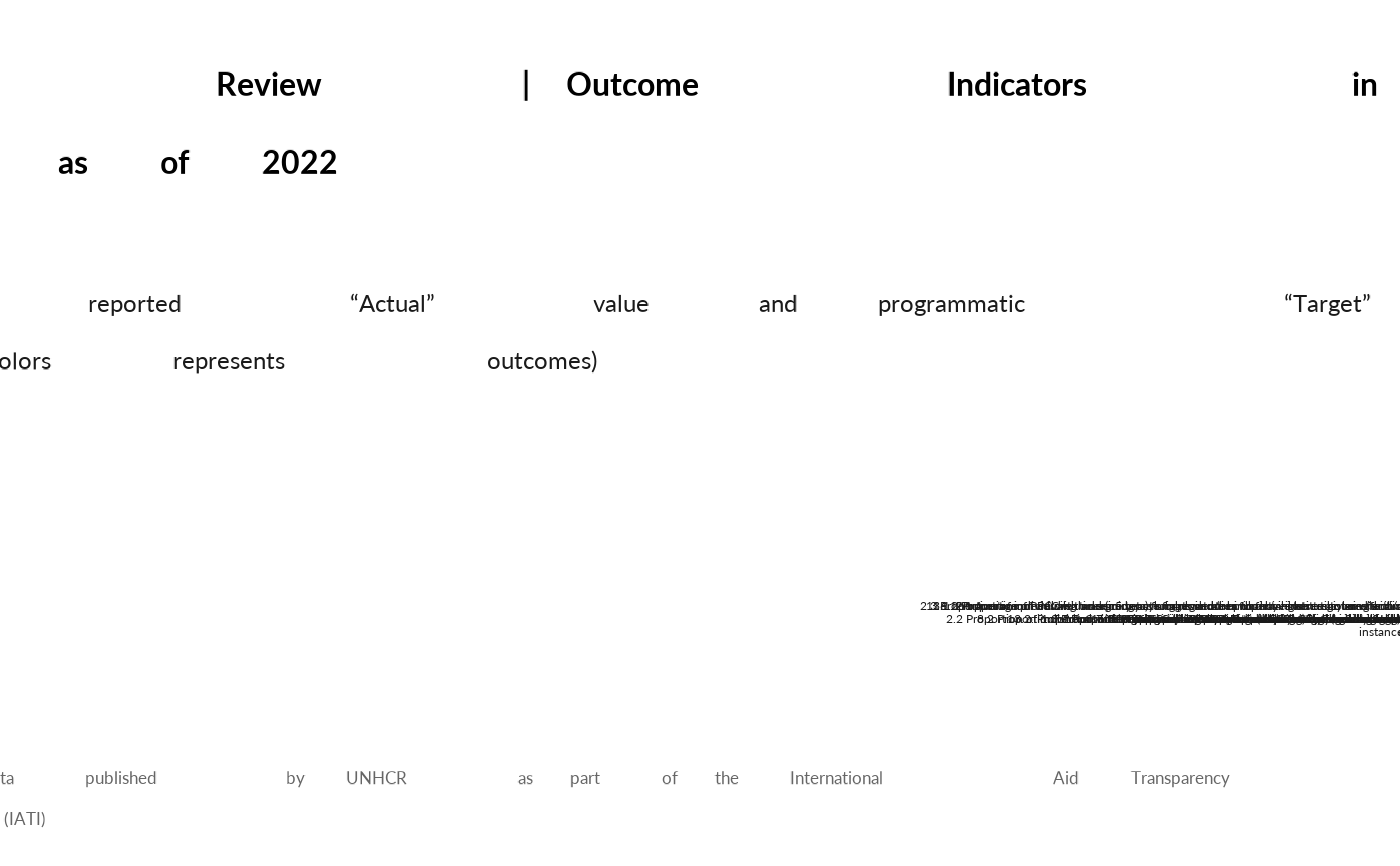 show_indicators(year = 2022,
ctr_name = "Brazil",
result_type_name = "Outcome",
type = "progress"
)
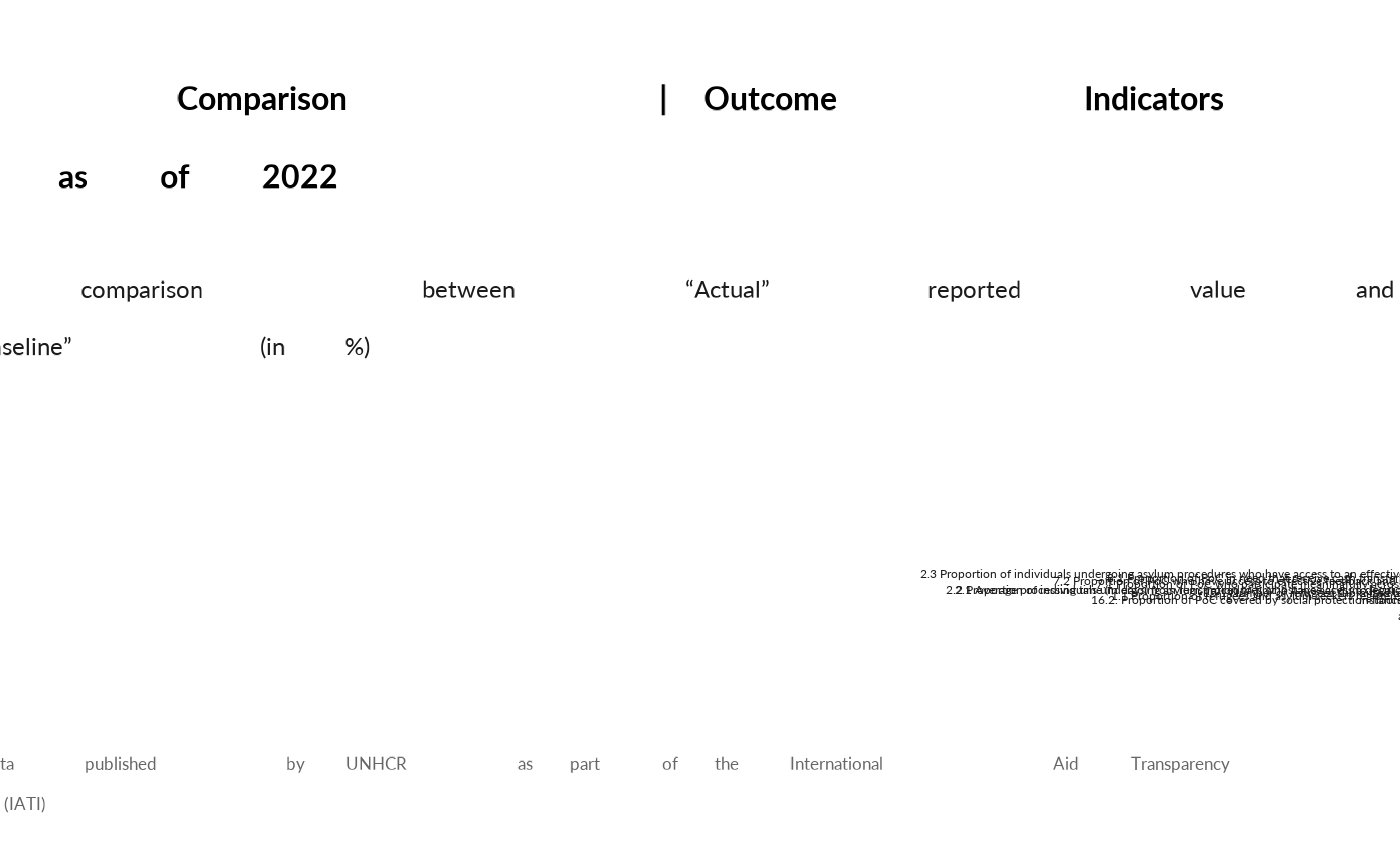 show_indicators(year = 2022,
ctr_name = "Brazil",
result_type_name = "Outcome",
type = "gap"
)
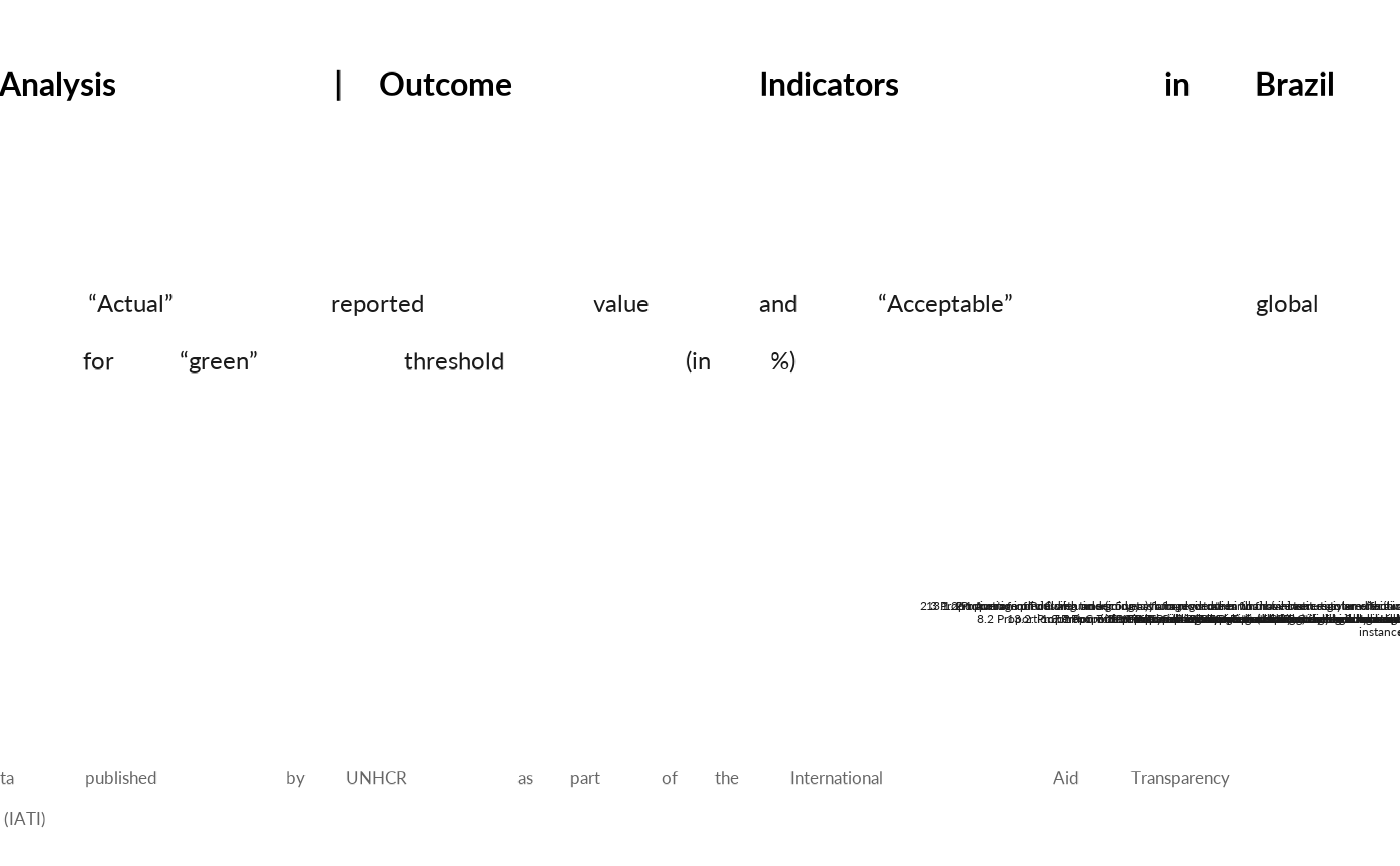 show_indicators(year = 2022,
ctr_name = "Brazil",
result_type_name = "Impact",
type = "deviation"
)
 show_indicators(year = 2022,
ctr_name = "Brazil",
result_type_name = "Impact",
type = "progress"
)
 show_indicators(year = 2019,
ctr_name = "Brazil",
result_type_name = "Output",
type = "deviation"
)
#> Warning: Removed 12 rows containing missing values (`position_stack()`).
#> Warning: Removed 12 rows containing missing values (`geom_text()`).
 show_indicators(year = 2019,
ctr_name = "Brazil",
result_type_name = "Output",
type = "progress"
)
