Generate a bullet chart for in country indicator gap analysis
Source:R/incountry_gap.R
incountry_gap.RdThis chart is designed to allow for quick gap analysis based on all outcome indicators within the same country
Arguments
- data
RBM QA dataset - expect a few pre-defined variables to works well..
- budget
table from results.unhcr.org 4.6.1_Budget_Download.xlsx
- thisoperation_mco
which operation plan to chart
Examples
data <- prepare_qa_data(activityInfoTable= "cdn6y40lm87wi522")
budget <- readxl::read_excel( system.file("4.6.1_Budget_Download.xlsx", package = "ProgQA"), skip = 1)|>
#budget <- readxl::read_excel( here::here("data-raw", "4.6.1_Budget_Download.xlsx"), skip = 1)|>
janitor::clean_names()
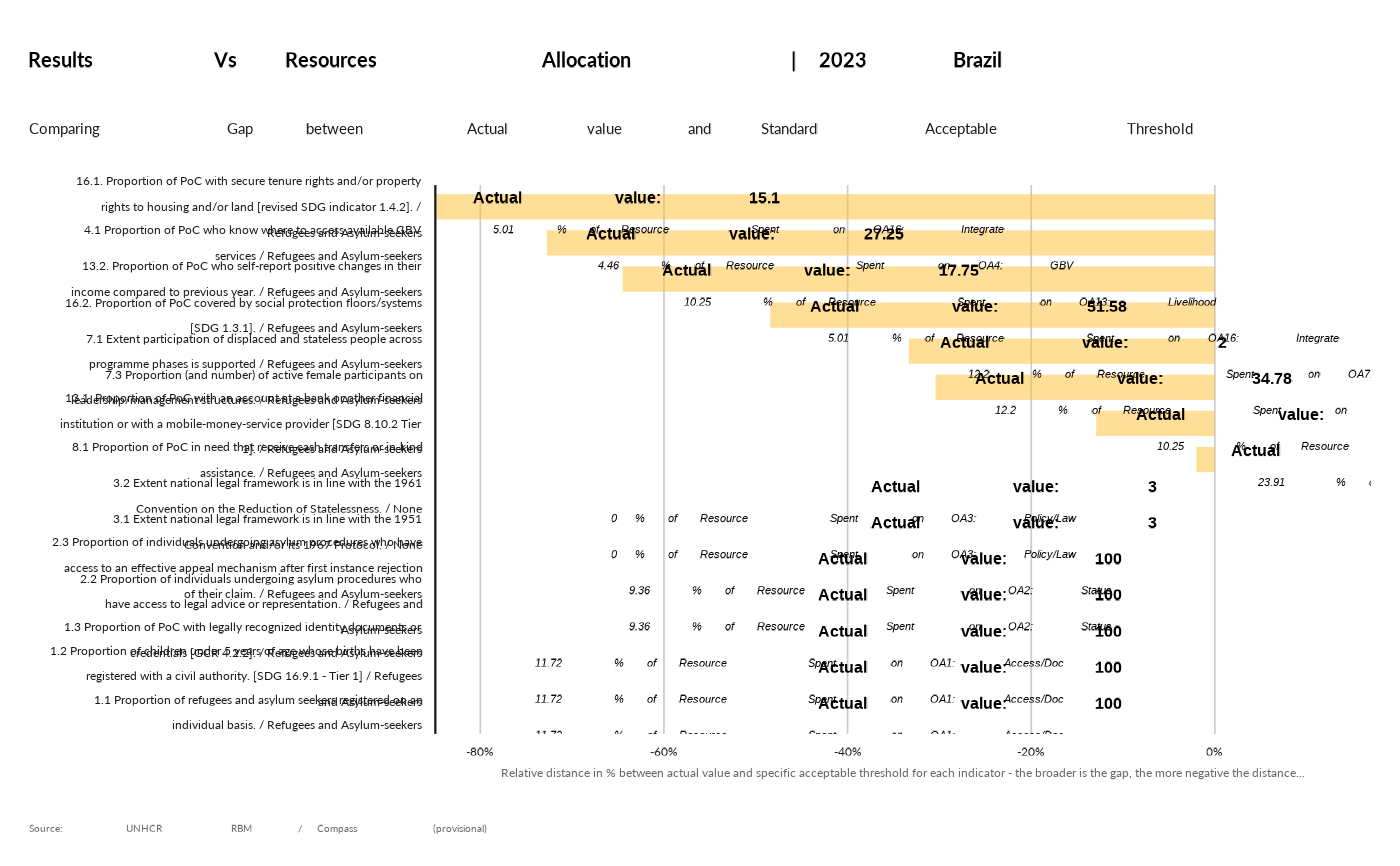
incountry_gap(data,budget, thisoperation_mco = "Brazil ABC" )
#> ── Attaching core tidyverse packages ──────────────────────── tidyverse 2.0.0 ──
#> ✔ dplyr 1.1.4 ✔ readr 2.1.5
#> ✔ forcats 1.0.0 ✔ stringr 1.5.1
#> ✔ ggplot2 3.4.4 ✔ tibble 3.2.1
#> ✔ lubridate 1.9.3 ✔ tidyr 1.3.1
#> ✔ purrr 1.0.2
#> ── Conflicts ────────────────────────────────────────── tidyverse_conflicts() ──
#> ✖ dplyr::filter() masks stats::filter()
#> ✖ dplyr::lag() masks stats::lag()
#> ℹ Use the conflicted package (<http://conflicted.r-lib.org/>) to force all conflicts to become errors
#> $plot
 #>
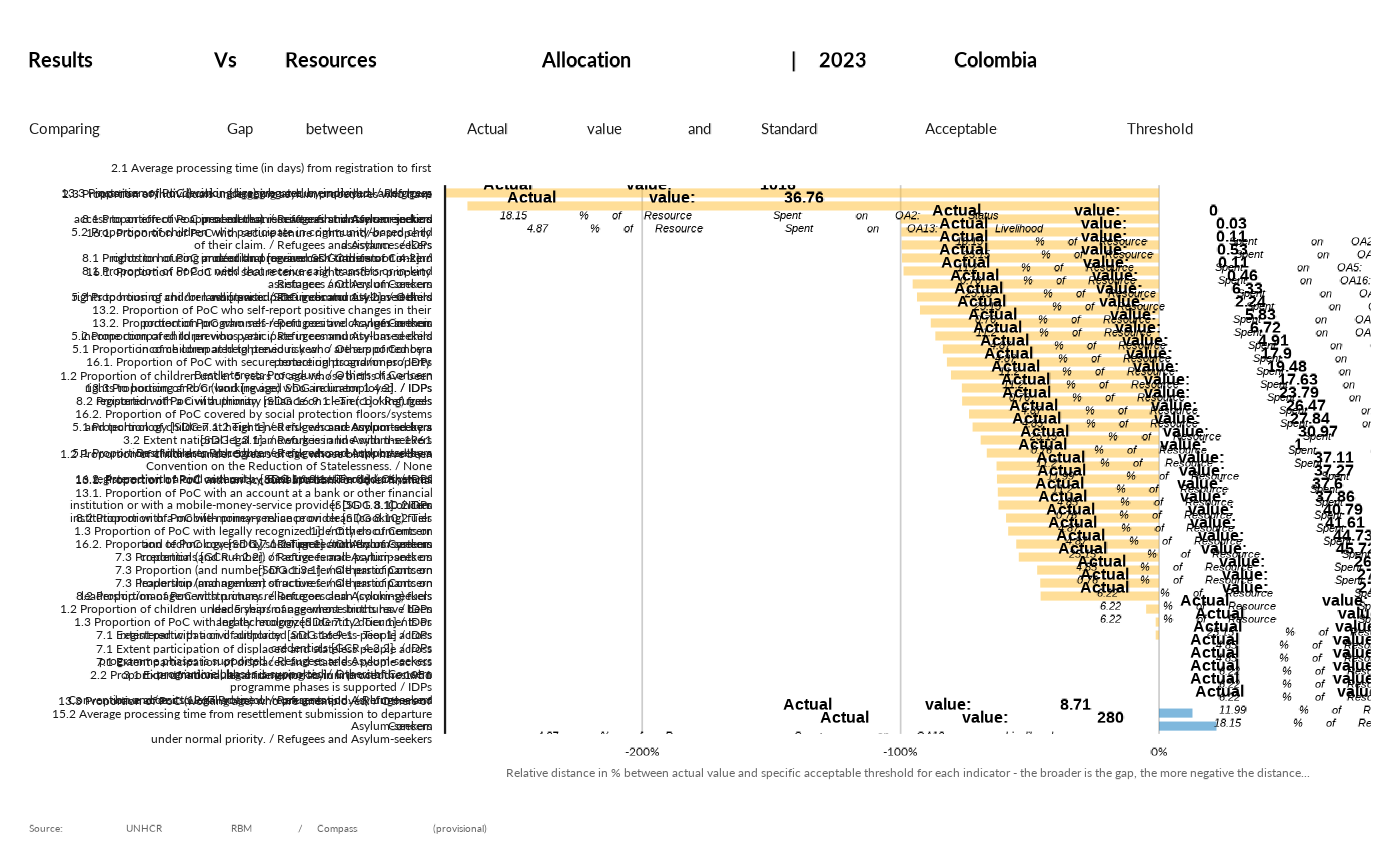
incountry_gap(data,budget, thisoperation_mco = "Colombia ABC" )
#> $plot
#>
incountry_gap(data,budget, thisoperation_mco = "Colombia ABC" )
#> $plot
 #>
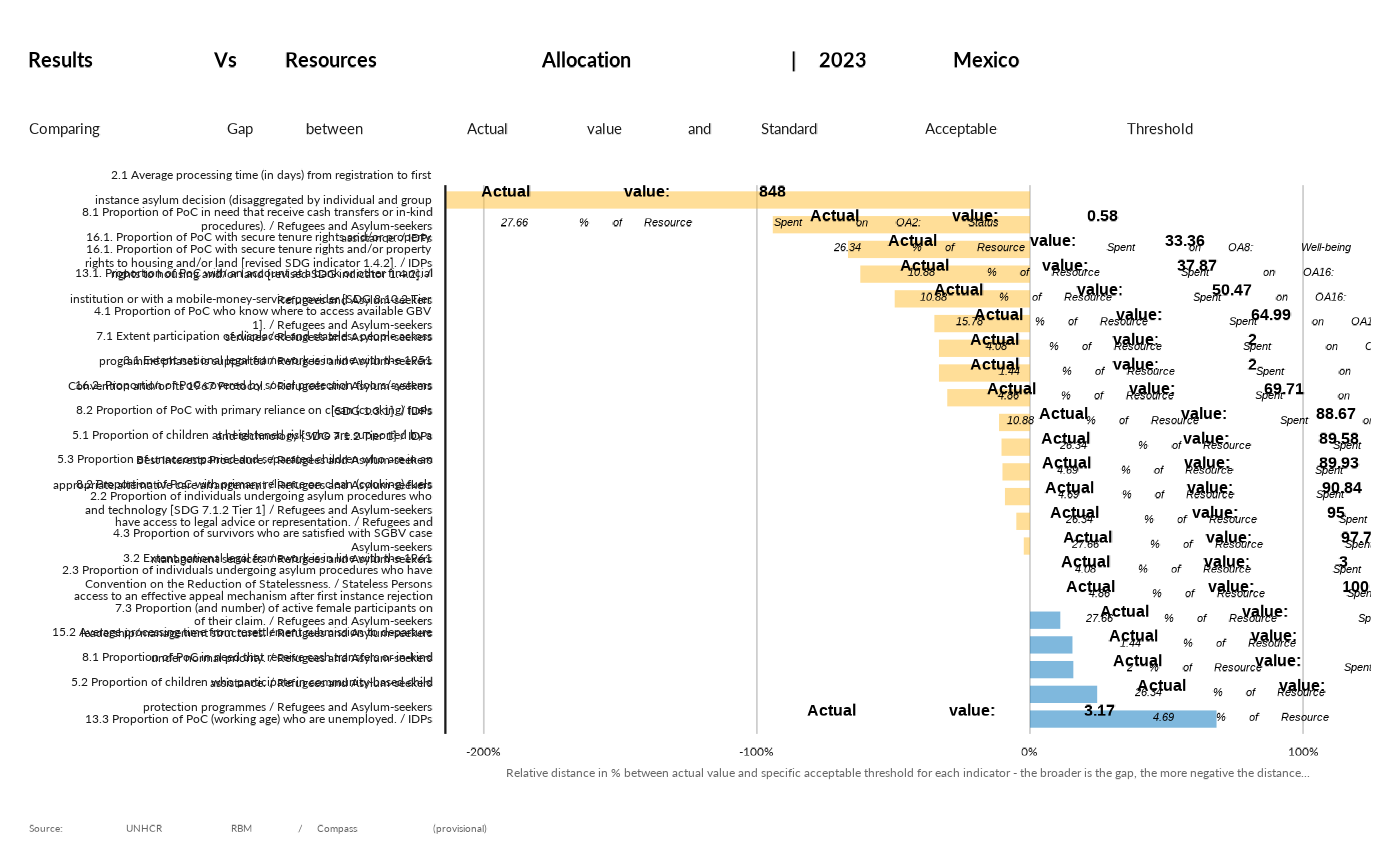
incountry_gap(data,budget, thisoperation_mco = "Mexico ABC" )
#> $plot
#>
incountry_gap(data,budget, thisoperation_mco = "Mexico ABC" )
#> $plot
 #>
#>