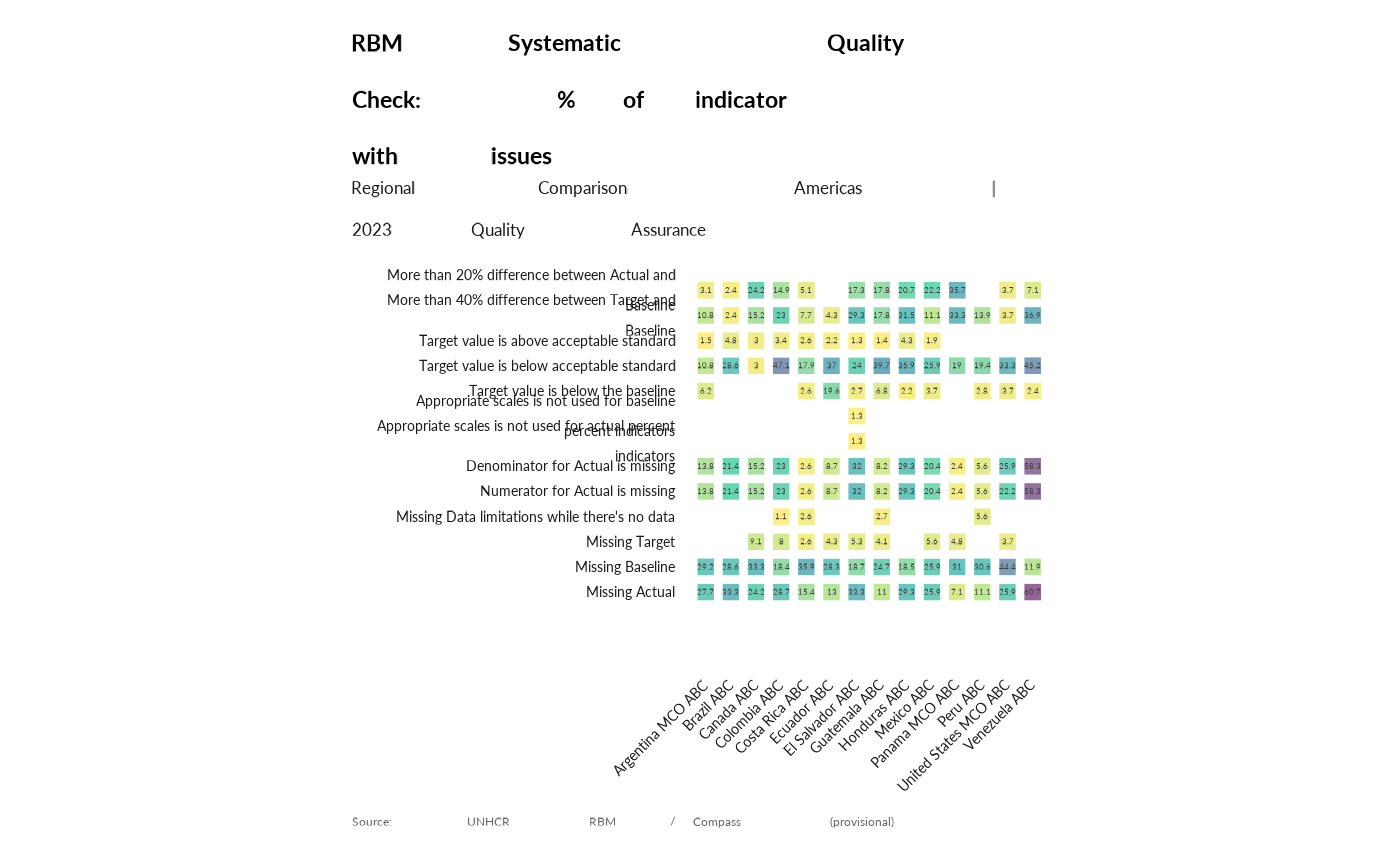
Display a summary QA charts based on data
Examples
data <- prepare_qa_data(activityInfoTable= "cdn6y40lm87wi522")
summary_qa_chart(data)
#> Coordinate system already present. Adding new coordinate system, which will
#> replace the existing one.

Display a summary QA charts based on data
data <- prepare_qa_data(activityInfoTable= "cdn6y40lm87wi522")
summary_qa_chart(data)
#> Coordinate system already present. Adding new coordinate system, which will
#> replace the existing one.
