Wrapper for a summary chart for indicator - allows to add hint, source, icon and interpretation threshold if available
Usage
fct_plot_indic_donut(
  indicator,
  subtitle_chart = NULL,
  caption_chart = NULL,
  ordered_threhold = NULL,
  iconunicode = "f496"
)
Arguments
- indicator
vector
- subtitle_chart
subtitle for the chart
- caption_chart
caption for the chart
- ordered_threhold
vector with the different threshold (green, orange, red)
- iconunicode
unicode value for fontawesome --- see https://fontawesome.com/search?o=r&m=free
Examples
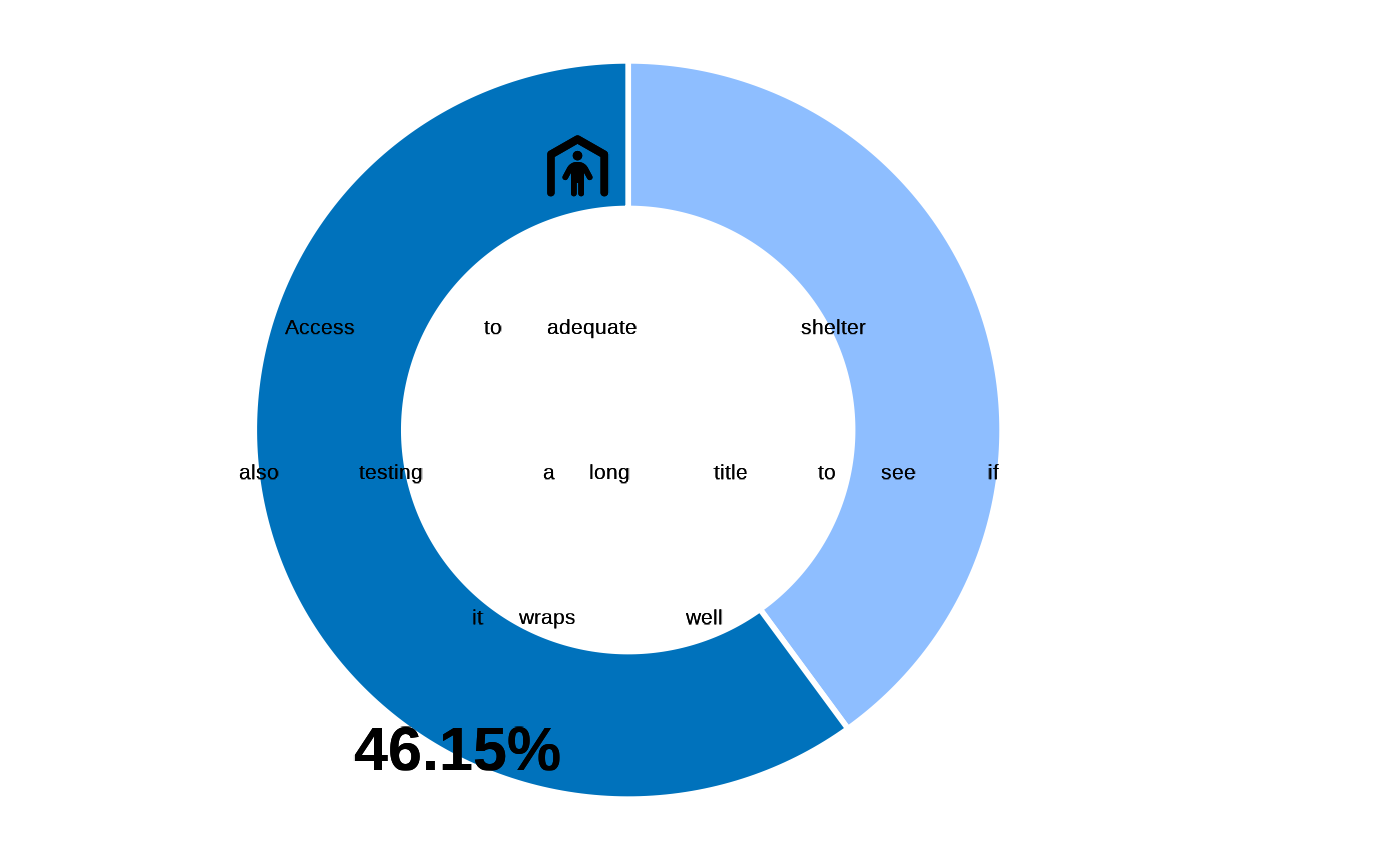
test <- data.frame(
  shelter = c(rbinom(20, 1, 0.5), NA, NA, NA, NA, NA, NA) ) |>
  dplyr::mutate( shelter =
  labelled::labelled( shelter,
    labels = c( "Yes" = 1, "No" = 0),
label = "Access to adequate shelter also testing a long title to see if it wraps well"))

fct_plot_indic_donut(indicator = test$shelter,
                     subtitle_chart = NULL,
                     caption_chart = NULL,
                     ordered_threhold = NULL,
                     iconunicode = "e54f")


## test no value
test2 <- NULL

fct_plot_indic_donut(indicator = test2,
                     subtitle_chart = NULL,
                     caption_chart = NULL,
                     ordered_threhold = NULL,
                     iconunicode = "e54f")
#> No value was supplied for plotting...
## test no value
test2 <- NULL
fct_plot_indic_donut(indicator = test2,
subtitle_chart = NULL,
caption_chart = NULL,
ordered_threhold = NULL,
iconunicode = "e54f")
#> No value was supplied for plotting...