Indicators calculation functions
Source:vignettes/indicators-calculation-functions.Rmd
indicators-calculation-functions.RmdImpact Indicators
impact_2_2
## data, cf example  fct_re_map()
datalist <- kobocruncher::kobo_data( system.file("dummy_RMS_CAPI_v2_mapped.xlsx",
                                                 package = "IndicatorCalc"))
## Apply calculation
datalist <-  impact_2_2(datalist)
#> ✔ HEA01
#> ✔ HEA02
#> ✔ HEA03
#> ✔ LIGHT01
#> ✔ LIGHT02
#> ✔ LIGHT03
#> ✔ DWA01
#> ✔ DWA02
#> ✔ DWA03a
#> ✔ DWA03b
#> ✔ DWA04
#> ✔ DWE01
#> ✔ DWE02
#> ✔ DWE03
#> ✔ DWE04
#> ✔ DWE05
#> ✔ DWE08
#> ✔ DWE09
#> ✔ HH01

table(datalist[["main"]]$impact2_2, useNA = "ifany")
#>
#>    0    1
#> 1492    8

fct_plot_indic_donut(indicator = datalist[["main"]]$impact2_2,
iconunicode = "f140") 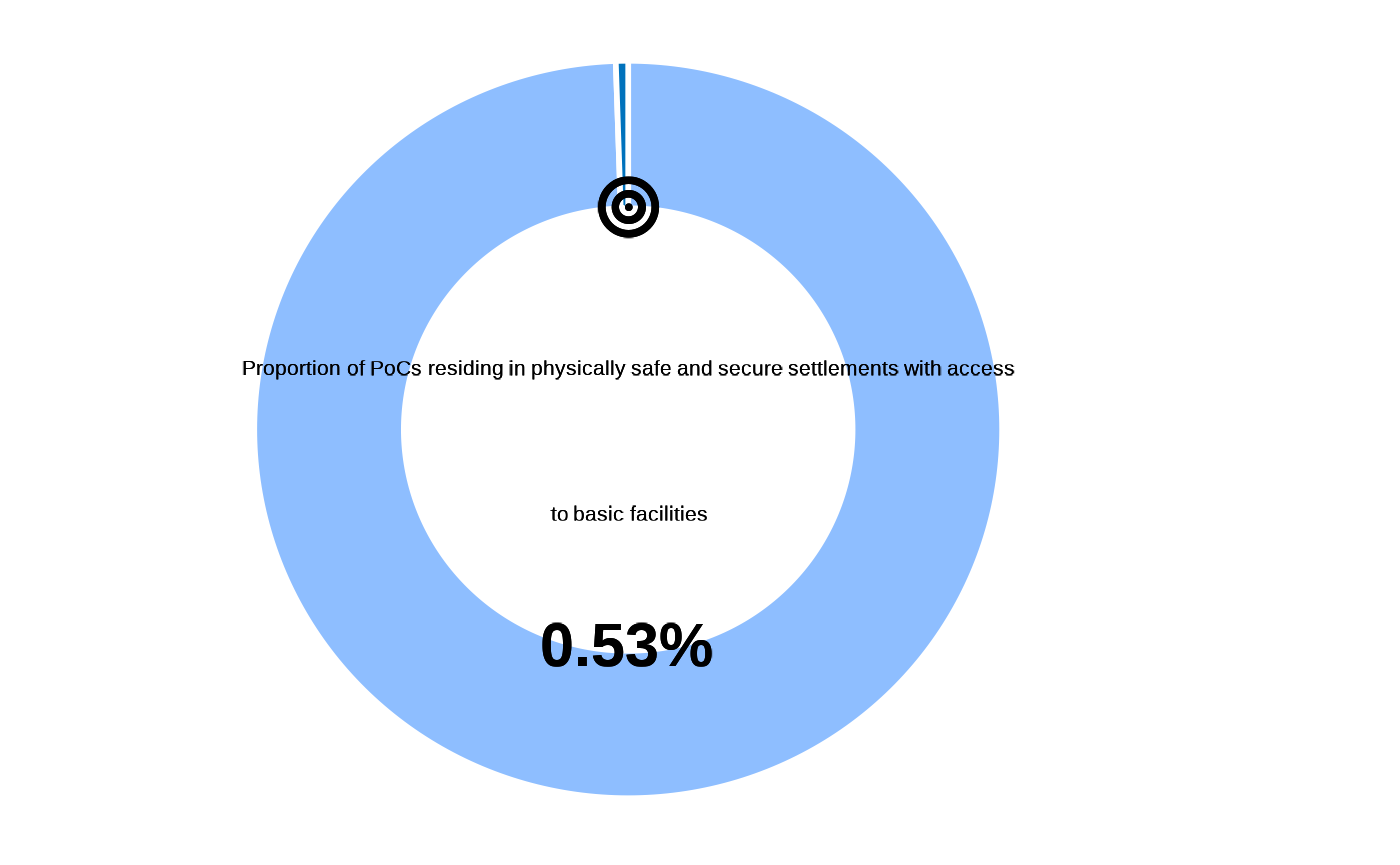
## Can get the details as well

table(datalist[["main"]]$electricity, useNA = "ifany")
#>
#>   0   1
#> 763 737
fct_plot_indic_donut(indicator = datalist[["main"]]$electricity,
iconunicode = "f0e7") 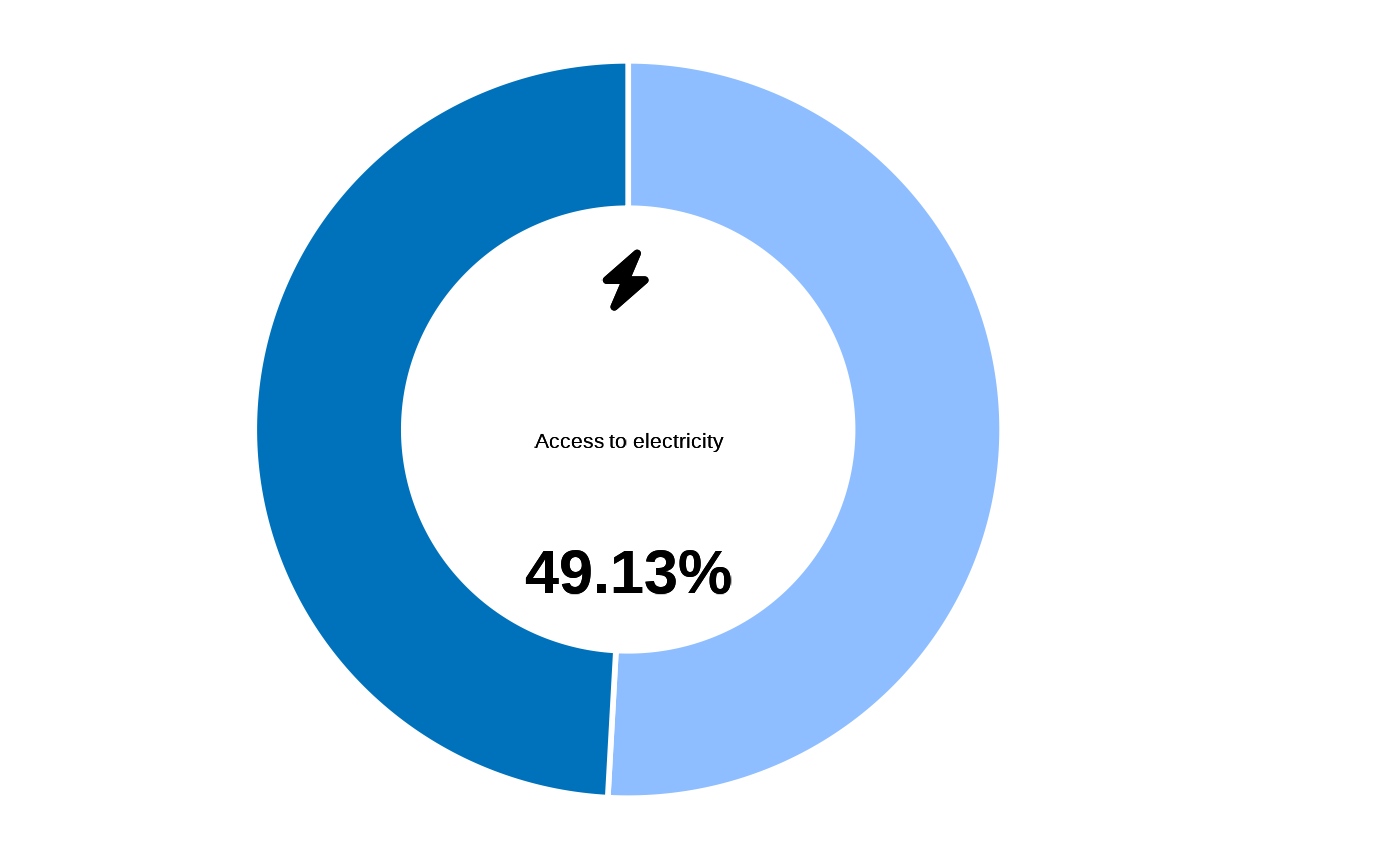
table(datalist[["main"]]$healthcare, useNA = "ifany")
#>
#>   0   1
#> 549 951
fct_plot_indic_donut(indicator = datalist[["main"]]$healthcare,
iconunicode = "f479") 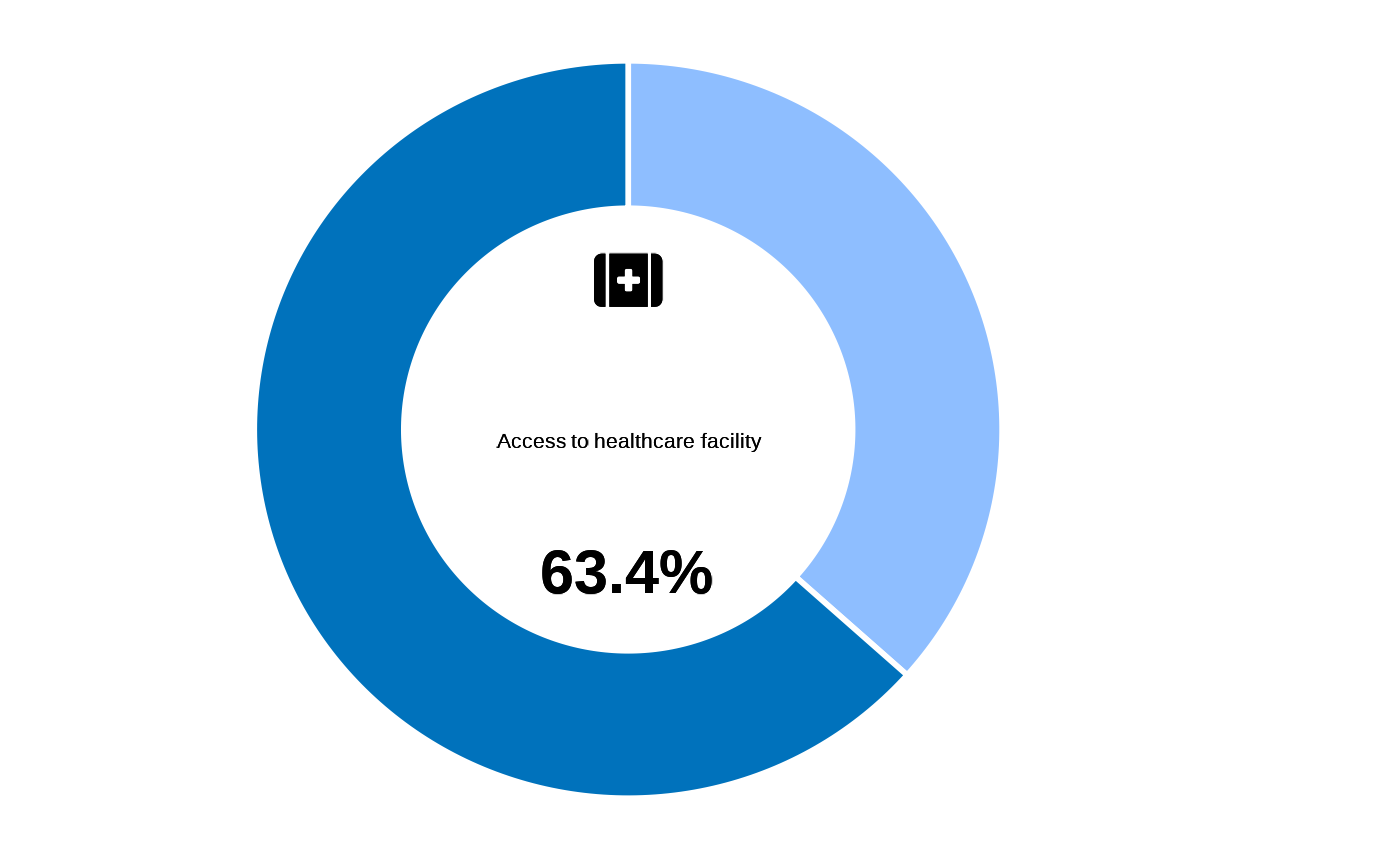
table(datalist[["main"]]$drinkingwater, useNA = "ifany")
#>
#>    0    1
#>  426 1074
fct_plot_indic_donut(indicator = datalist[["main"]]$drinkingwater,
iconunicode = "e006") 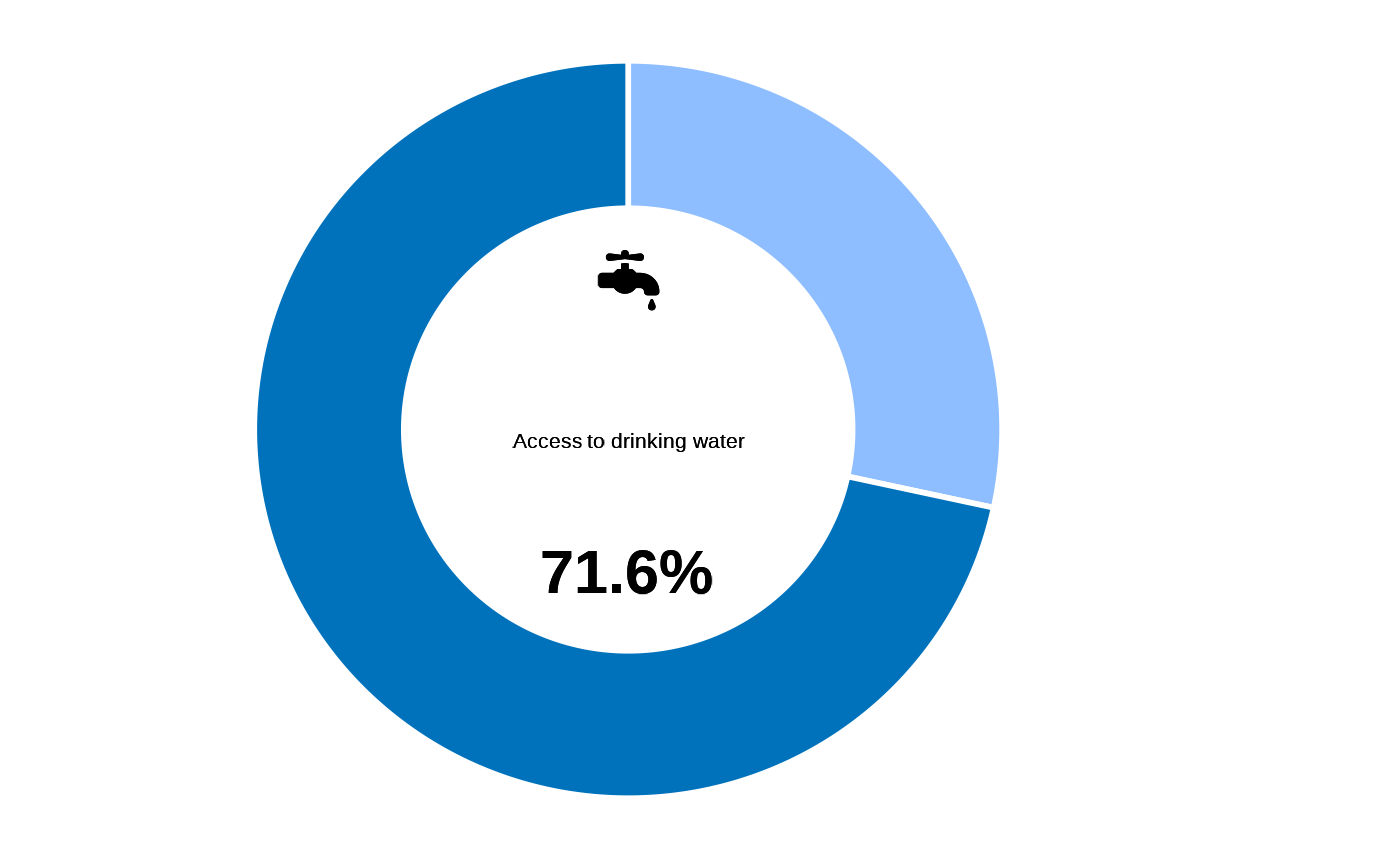
## Check intermediary variables
table(datalist[["main"]]$dwa_cond1, useNA = "ifany")
#>
#>    1
#> 1500
table(datalist[["main"]]$reachableU30, useNA = "ifany")
#>
#>    0    1
#> 1246  254
table(datalist[["main"]]$DWA02, useNA = "ifany")
#>
#>   1   2   3
#> 497 476 527
table(datalist[["main"]]$dwa_cond2, useNA = "ifany")
#>
#>    0    1
#>  426 1074

# Tabulate
table(datalist[["main"]]$dwe01_cat, useNA = "ifany")
#>
#>    0    1
#> 1212  288
table(datalist[["main"]]$dwe02_cat, useNA = "ifany")
#>
#>    0    1
#>  422 1078
table(datalist[["main"]]$dwe03_cat, useNA = "ifany")
#>
#>   0   1
#> 835 665
table(datalist[["main"]]$dwe04_cat, useNA = "ifany")
#>
#>   0   1
#> 952 548
table(datalist[["main"]]$dwe05_cat, useNA = "ifany")
#>
#>    0    1
#>  258 1242
table(datalist[["main"]]$shelter, useNA = "ifany")
#>
#>    0    1
#> 1472   28
#plot
fct_plot_indic_donut(datalist[["main"]]$shelter,
iconunicode = "e54f") 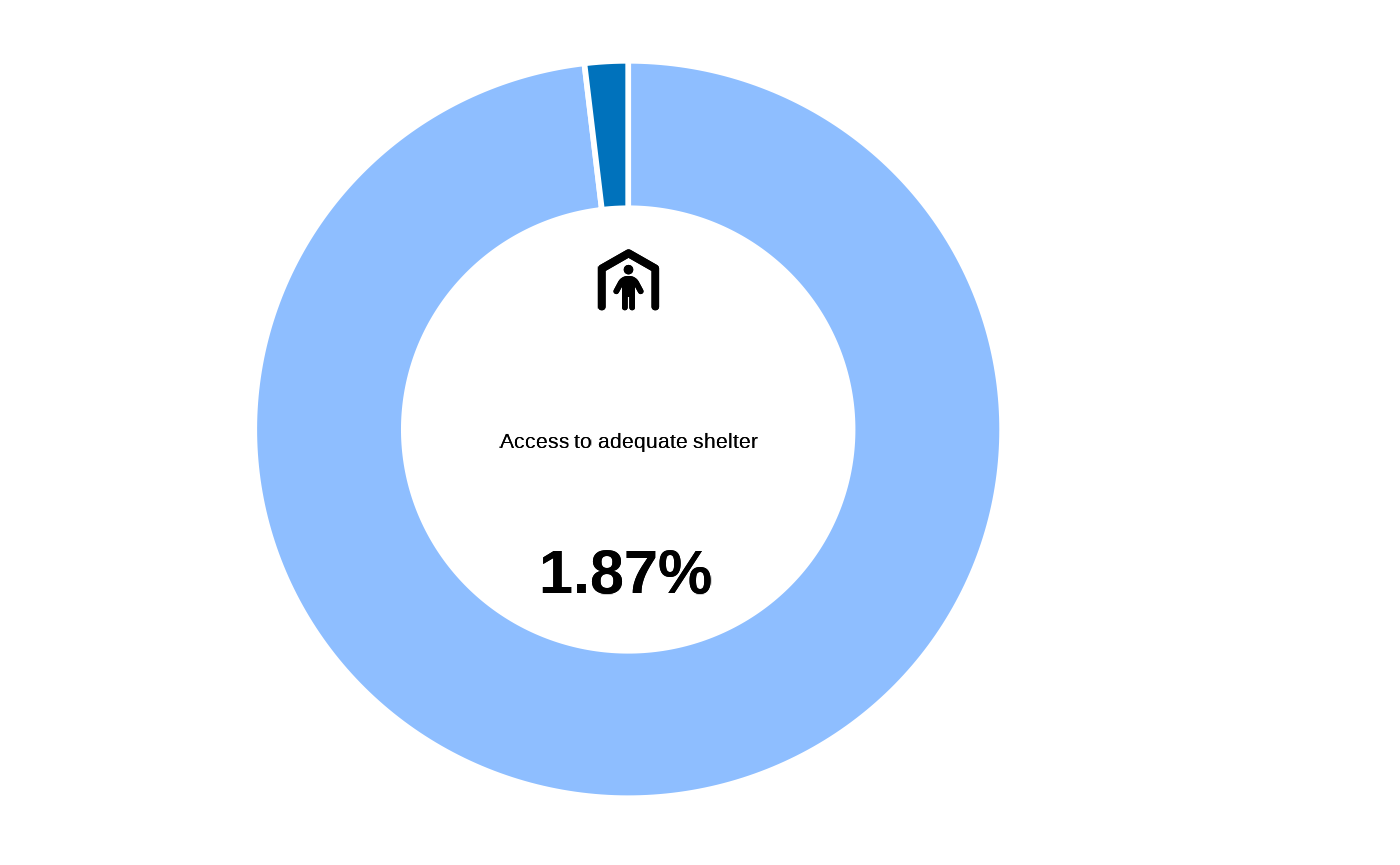
impact2_3
## data, cf example  fct_re_map()
# datalist <- kobocruncher::kobo_data( system.file("dummy_RMS_CAPI_v2_mapped.xlsx",
#                                                  package = "IndicatorCalc"))
# ## Apply calculation
# datalist <- impact2_3(datalist )
#
# ## Visualise value
# fct_plot_indic_donut(indicator = datalist[["ind"]]$impact2_3,
#                      iconunicode = "f140")
impact3_2a
## data, cf example  fct_re_map()
datalist <- kobocruncher::kobo_data( system.file("dummy_RMS_CAPI_v2_mapped.xlsx",
                                                 package = "IndicatorCalc"))
## Apply calculation
datalist <- impact3_2a(datalist  )
#> ✔ EDU01
#> ✔ EDU02
#> ✔ EDU03
#> ✔ EDU04
#> ✔ HH07
table(datalist[["ind"]]$impact3_2a, useNA = "ifany")
#>
#> 0.717948717948718
#>              1500
table(datalist[["ind"]]$edu_primary, useNA = "ifany")
#>
#>    0    1
#> 1444   56
table(datalist[["ind"]]$age_primary, useNA = "ifany")
#>
#>    1 <NA>
#>   78 1422

## Visualise value
fct_plot_indic_donut(indicator = datalist[["ind"]]$impact3_2a,
iconunicode = "f140") 
impact3_2b
## data, cf example  fct_re_map()
datalist <- kobocruncher::kobo_data( system.file("dummy_RMS_CAPI_v2_mapped.xlsx",
                                                 package = "IndicatorCalc"))
## Apply calculation
datalist <- impact3_2b(datalist )
#> ✔ EDU01
#> ✔ EDU02
#> ✔ EDU03
#> ✔ EDU04
#> ✔ HH07

## Visualise value
fct_plot_indic_donut(indicator = datalist[["ind"]]$impact3_2b,
iconunicode = "f140") 
impact3_3
## data, cf example  fct_re_map()
datalist <- kobocruncher::kobo_data( system.file("dummy_RMS_CAPI_v2_mapped.xlsx",
                                                 package = "IndicatorCalc"))
## Apply calculation
datalist <- impact3_3(datalist)
#> ✔ SAF01

## Visualise value
fct_plot_indic_donut(indicator = datalist[["main"]]$impact3_3,
iconunicode = "f140") 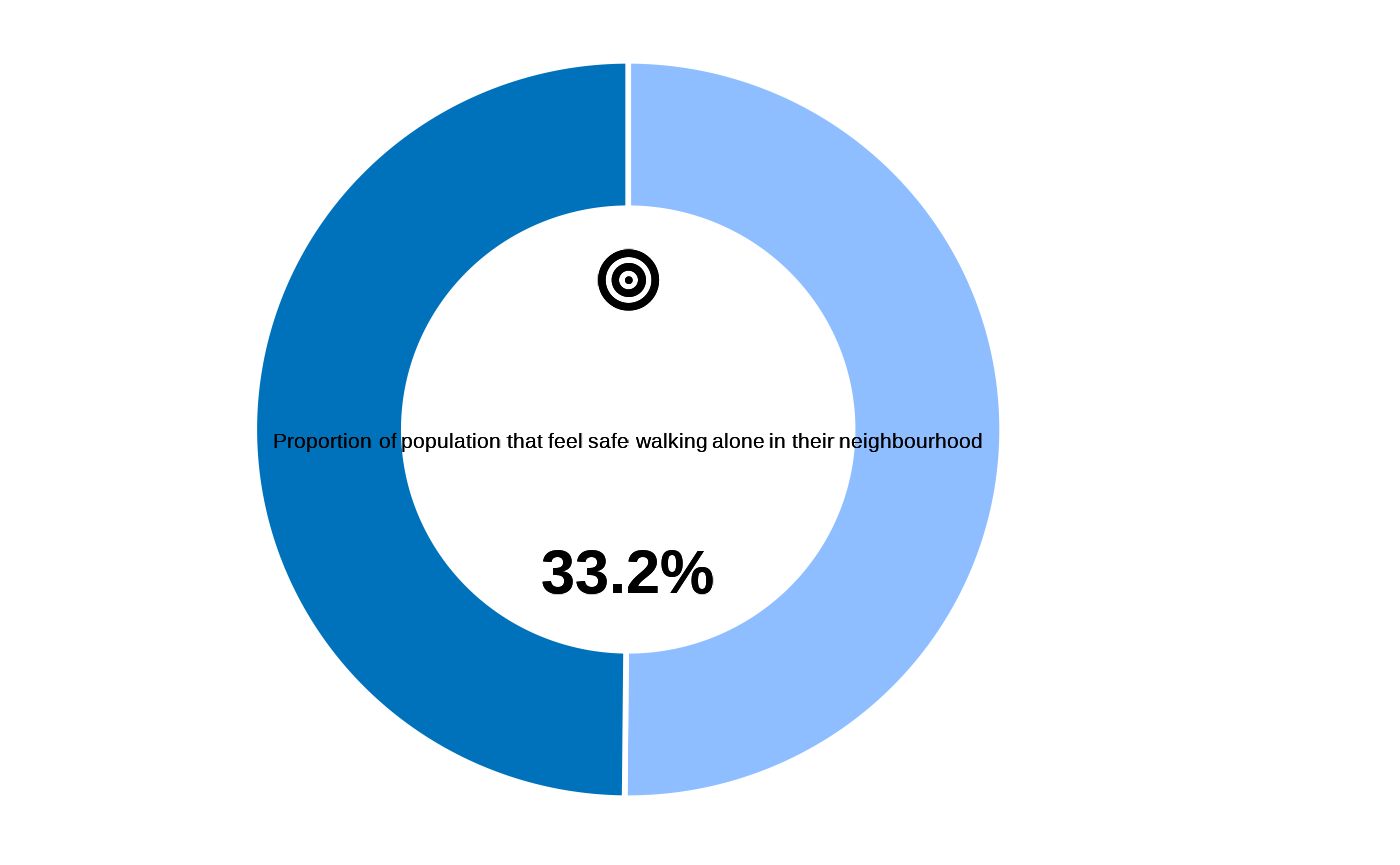
Outcome indicators
outcome1_2
## data, cf example  fct_re_map()
datalist <- kobocruncher::kobo_data( system.file("dummy_RMS_CAPI_v2_mapped.xlsx",
                                                 package = "IndicatorCalc"))

## Apply indicator function on datalist
datalist <- outcome1_2(datalist)
#> ✔ REG03
#> ✔ REG04
#> ✔ HH07
table(datalist[["ind"]]$outcome1_2, useNA = "ifany")
#>
#>    0    1 <NA>
#>   21   28 1451
table(datalist[["ind"]]$less_than_5, useNA = "ifany")
#>
#>    0    1
#> 1438   62
table(datalist[["ind"]]$HH07, useNA = "ifany")
#>
#>    0   10   11   12   13   14   15   16   17   18   19    2   20   21   22   23
#>   15   14   18   21   20    7   16   20   18   17   19   13   15   16   11   24
#>   24   25   26   27   28   29    3   30   31   32   33   34   35   36   37   38
#>   14   20   13   15   17   18   16   22   17   13   13   15   10   16    9   13
#>   39    4   40   41   42   43   44   45   46   47   48   49    5   50   51   52
#>    8   18   19    9   16   11   14   16   19   20   23   11   13   10    9   13
#>   53   54   55   56   57   58   59    6   60   61   62   63   64   65   66   67
#>   22   16   16   12   13   13   15   14   13   17   18    8   14   12   20   12
#>   68   69    7   70   71   72   73   74   75   76   77   78   79    8   80   81
#>   18   19   14   18   22   13   19   17   16   20   19   18   16   18   16    9
#>   82   83   84   85   86   87   88   89    9   90   91   92   93   94   95 <NA>
#>   19   21   18   13   12   23   12   20   18   18   11   18   23   14   12    7
barplot(as.integer(datalist[["ind"]]$HH07))
table(datalist[["ind"]]$birthCertificate, useNA = "ifany")
#>
#>   0   1
#> 979 521
table(datalist[["ind"]]$birthRegistered, useNA = "ifany")
#>
#>    0    1 <NA>
#>  762  378  360
## Visualise value
fct_plot_indic_donut(indicator = datalist[["ind"]]$outcome1_2,
iconunicode = "f140") 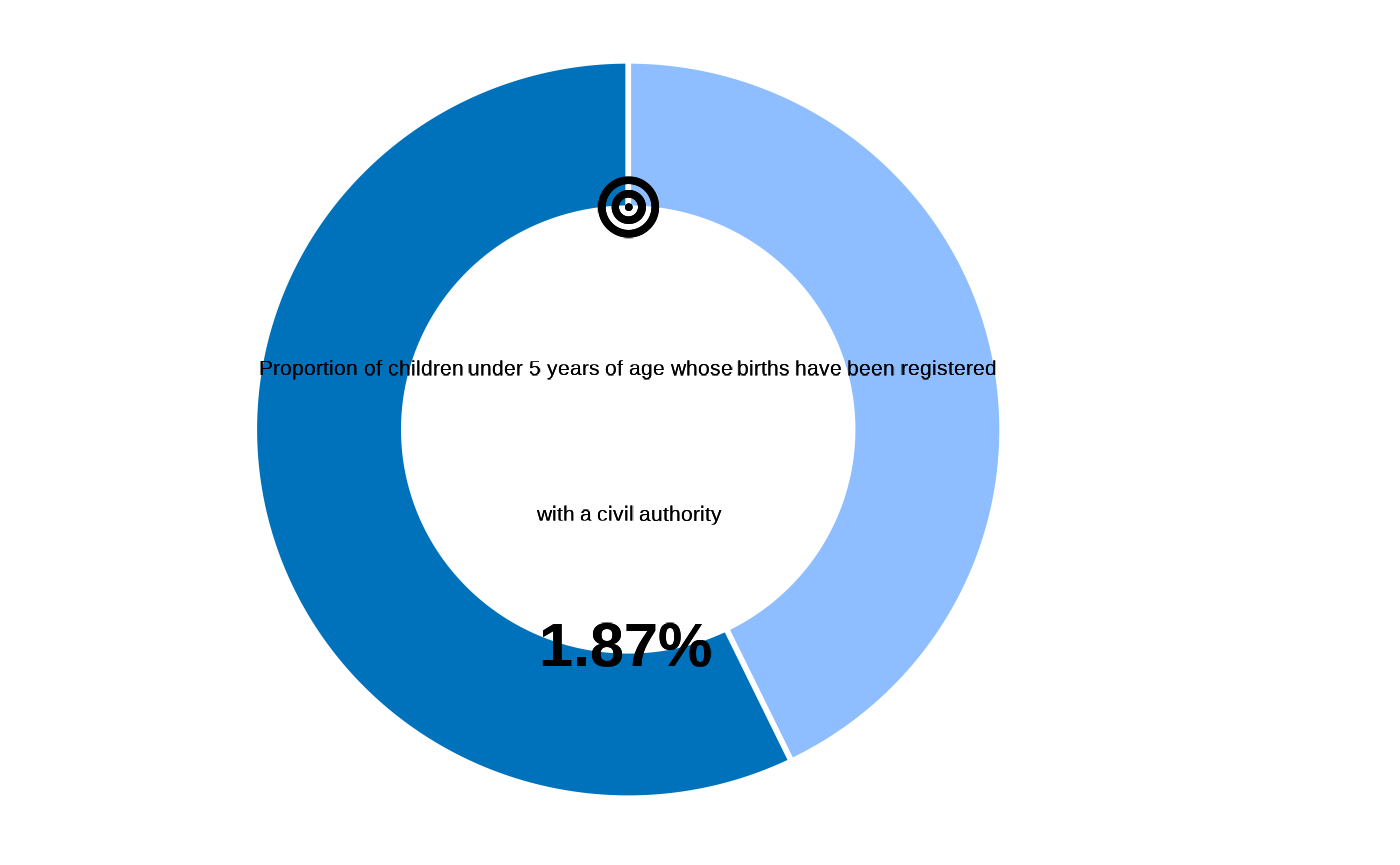
fct_plot_indic_donut(indicator = datalist[["ind"]]$birthCertificate,
iconunicode = "f140") 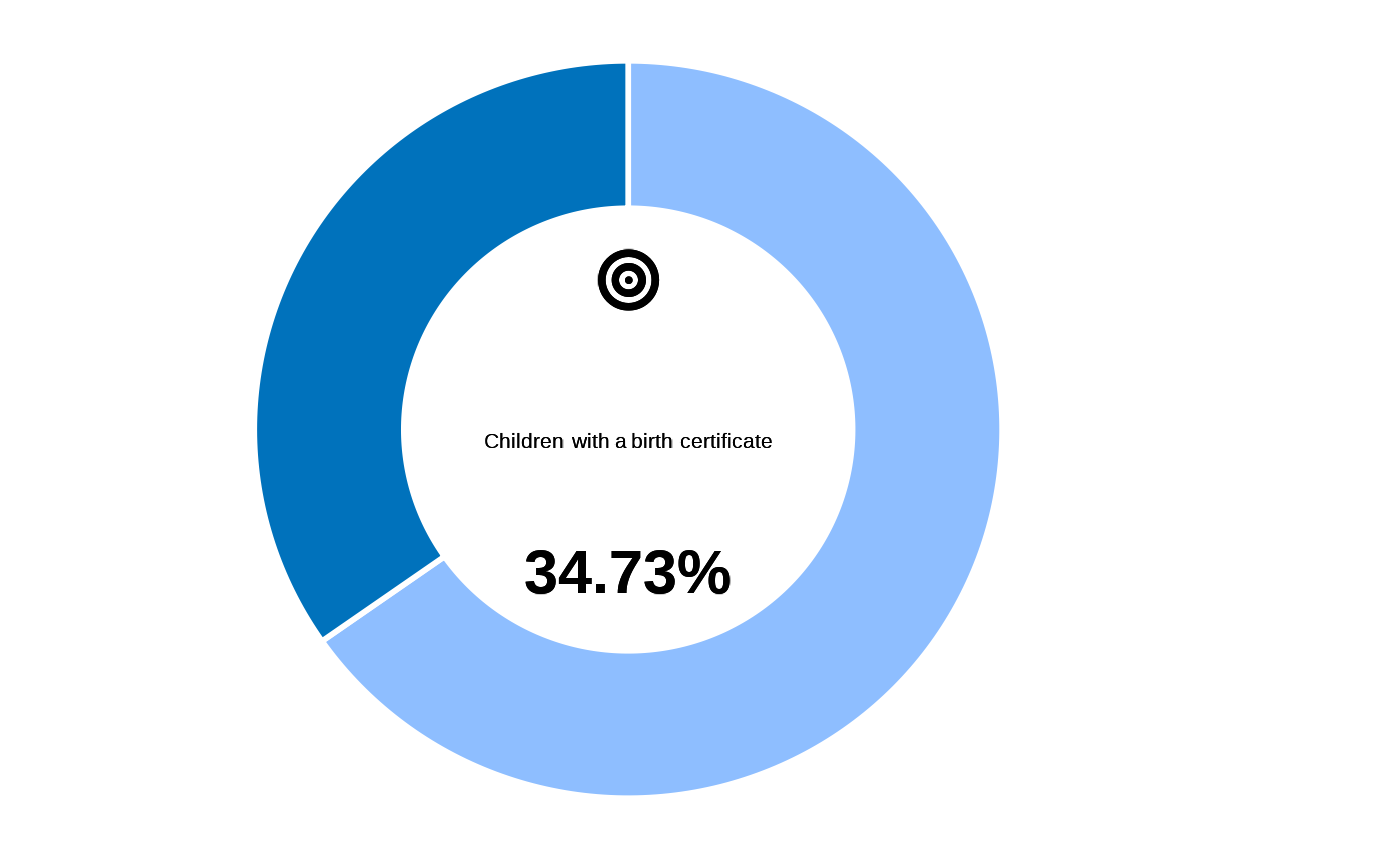
fct_plot_indic_donut(indicator = datalist[["ind"]]$birthRegistered,
iconunicode = "f140") 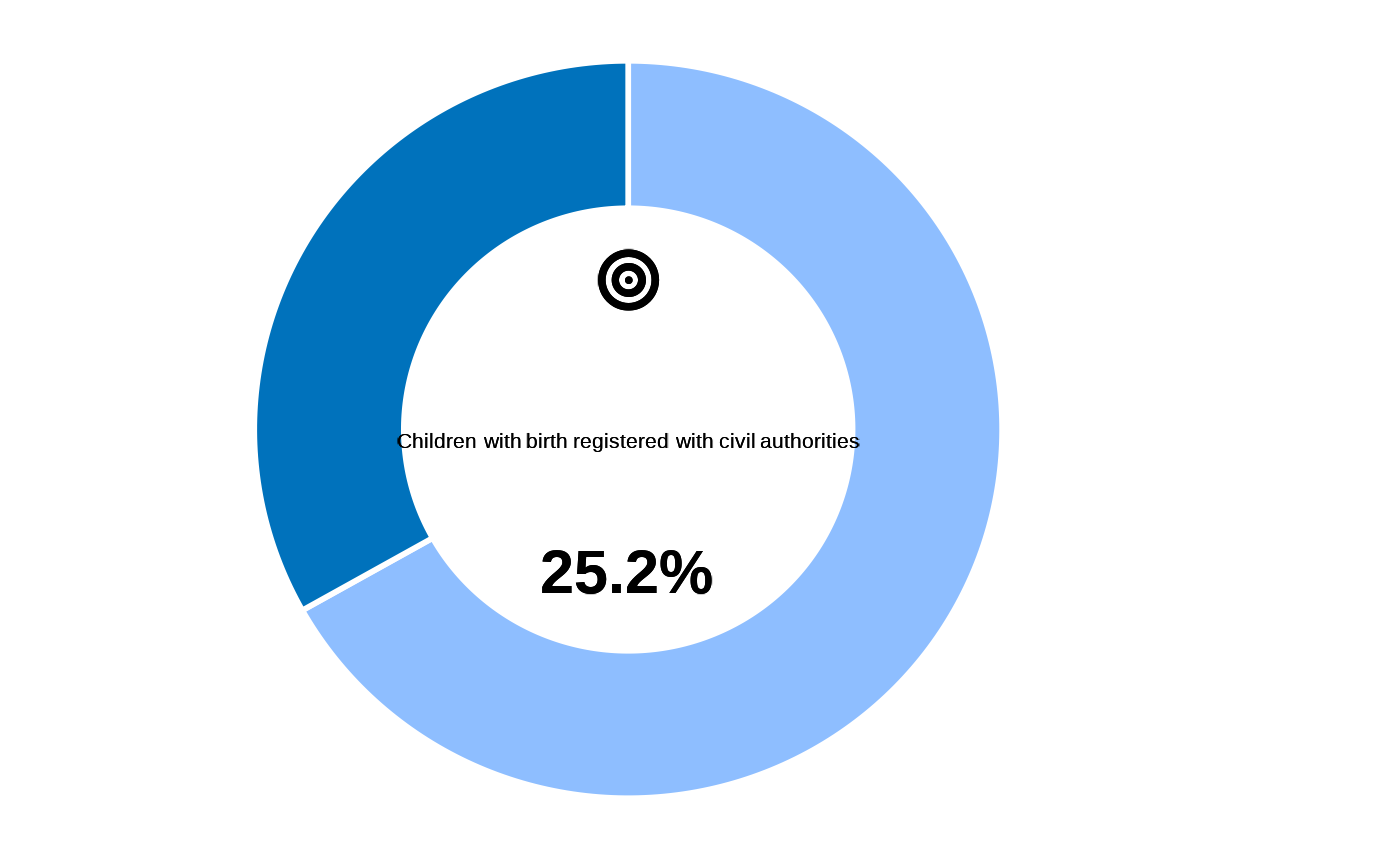
outcome1_3
## data, cf example  fct_re_map()
datalist <- kobocruncher::kobo_data( system.file("dummy_RMS_CAPI_v2_mapped.xlsx",
                                                 package = "IndicatorCalc"))
## Apply indicator function on datalist
datalist <- outcome1_3(datalist)
#> ✔ REG01a
#> ✔ REG01b
#> ✔ REG01c
#> ✔ REG01d
#> ✔ REG01e
#> ✔ REG01f
#> ✔ REG01g
#> ✔ REG02
#> ✔ REG03
#> ✔ REG05a
#> ✔ REG05b
#> ✔ REG05c
#> ✔ REG05d
#> ✔ REG05e
#> ✔ REG05f
#> ✔ REG06

## Visualise value
fct_plot_indic_donut(indicator = datalist[["ind"]]$outcome1_3,
iconunicode = "f140") 
fct_plot_indic_donut(indicator = datalist[["ind"]]$document_above5,
iconunicode = "f140") 
fct_plot_indic_donut(indicator = datalist[["ind"]]$document_under5,
iconunicode = "f140") 
outcome4_1
## data, cf example  fct_re_map()
datalist <- kobocruncher::kobo_data( system.file("dummy_RMS_CAPI_v2_mapped.xlsx",
                                                 package = "IndicatorCalc"))
## Apply indicator function on datalist
datalist <- outcome4_1(datalist )
#> ✔ GBV01a
#> ✔ GBV01b
#> ✔ GBV01c
#> ✔ GBV01d

## Visualise value
fct_plot_indic_donut(indicator = datalist[["main"]]$outcome1_4,
                     iconunicode = "f140")
#> No value was supplied for plotting...
outcome4_2
## data, cf example  fct_re_map()
datalist <- kobocruncher::kobo_data( system.file("dummy_RMS_CAPI_v2_mapped.xlsx",
                                                 package = "IndicatorCalc"))
## Apply indicator function on datalist
datalist <- outcome4_2(datalist)
#> ✔ VAW01a
#> ✔ VAW01b
#> ✔ VAW01c
#> ✔ VAW01d
#> ✔ VAW01e

## Visualise value
fct_plot_indic_donut(indicator = datalist[["main"]]$outcome4_2,
iconunicode = "f140") 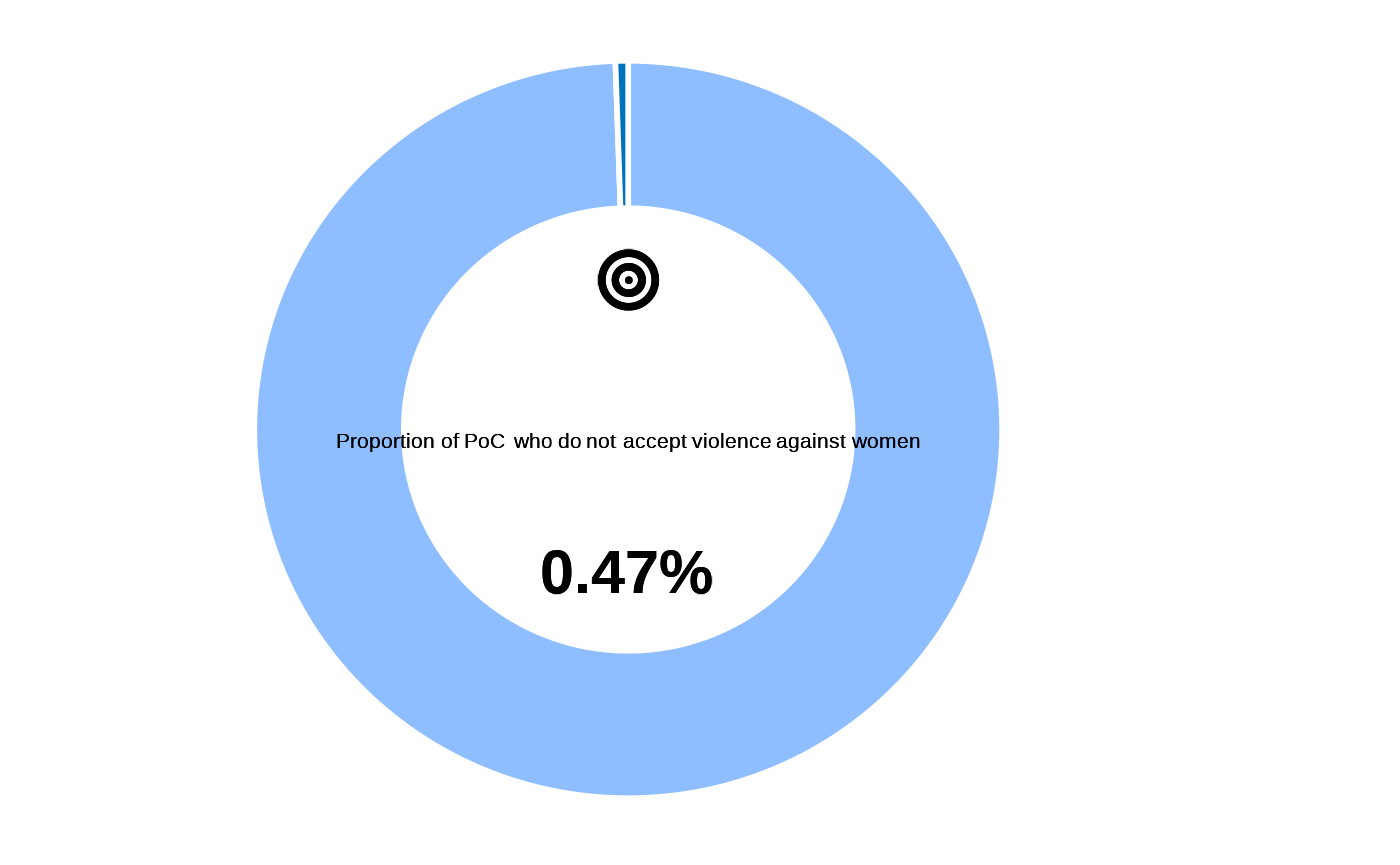
outcome5_2
## data, cf example  fct_re_map()
datalist <- kobocruncher::kobo_data( system.file("dummy_RMS_CAPI_v2_mapped.xlsx",
                                                 package = "IndicatorCalc"))
## Apply indicator function on datalist
datalist <- outcome5_2(datalist  )
#> ✔ COMM01
#> ✔ COMM02
#> ✔ COMM03
#> ✔ COMM04

## Visualise value
fct_plot_indic_donut(indicator = datalist[["ind"]]$outcome5_2,
iconunicode = "f140") 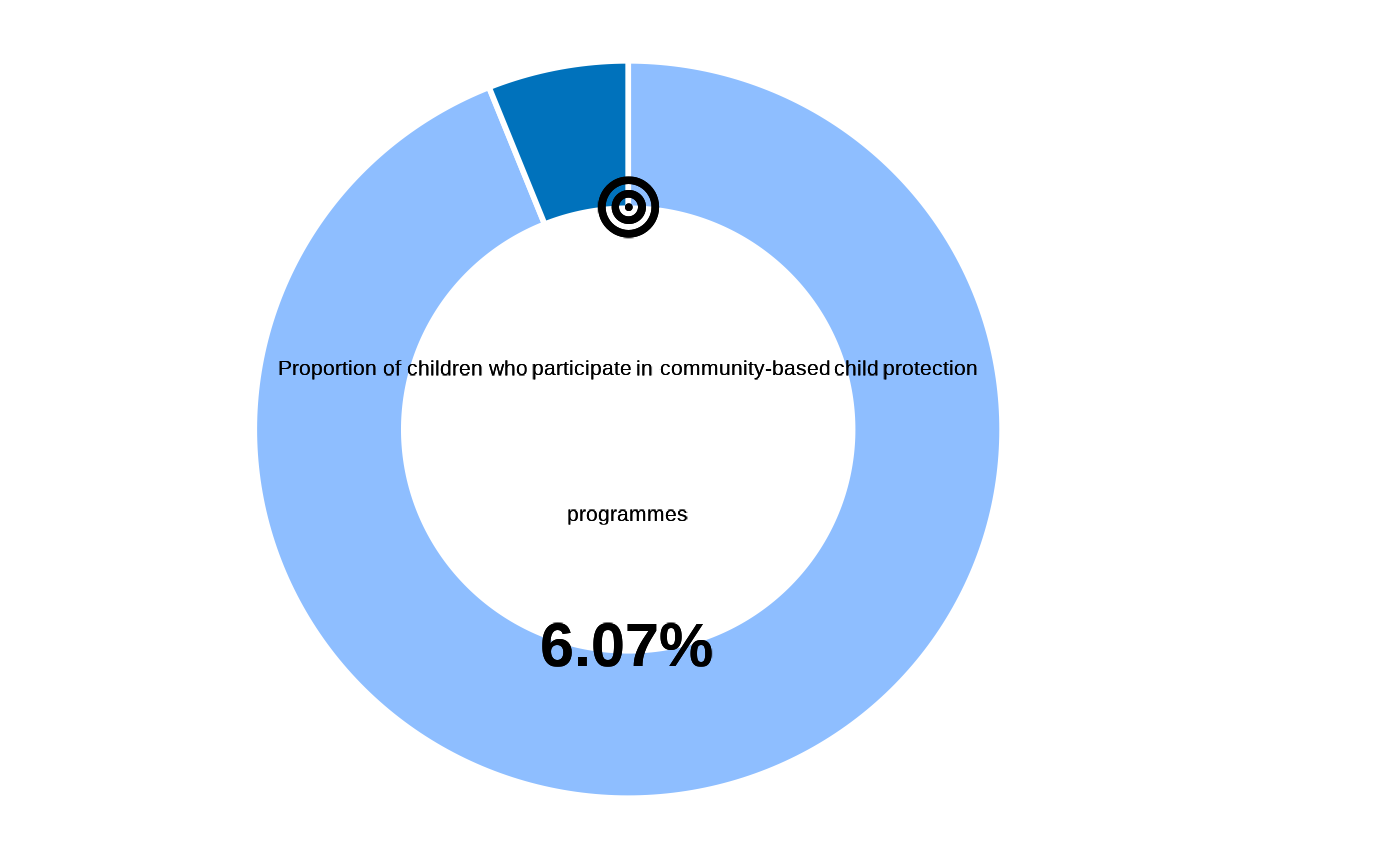
outcome8_2
## data, cf example  fct_re_map()
datalist <- kobocruncher::kobo_data( system.file("dummy_RMS_CAPI_v2_mapped.xlsx",
                                                 package = "IndicatorCalc"))
## Apply indicator function on datalist
datalist <- outcome8_2(datalist )
#> ✔ COOK01
#> ✖ COOK02 not found in the dataset.
#> ✖ COOK03 not found in the dataset.
#> There are missing data requirement to calculate Indicator Outcome 8.2

## Visualise value
fct_plot_indic_donut(indicator = datalist[["main"]]$outcome8_2,
                     iconunicode = "f140")
#> No value was supplied for plotting...
outcome9_1
## data, cf example  fct_re_map()
datalist <- kobocruncher::kobo_data( system.file("dummy_RMS_CAPI_v2_mapped.xlsx",
                                                 package = "IndicatorCalc"))
## Apply indicator function on datalist
datalist <- outcome9_1(datalist)
#> ✔ DWE01
#> ✔ DWE02
#> ✔ DWE03
#> ✔ DWE04
#> ✔ DWE05
#> ✔ DWE08
#> ✔ DWE09
#> ✔ HH01

## Visualise value
fct_plot_indic_donut(indicator = datalist[["main"]]$outcome9_1,
iconunicode = "f140") 
outcome9_2
## data, cf example  fct_re_map()
datalist <- kobocruncher::kobo_data( system.file("dummy_RMS_CAPI_v2_mapped.xlsx",
                                                 package = "IndicatorCalc"))
## Apply indicator function on datalist
datalist <- outcome9_2(datalist )
#> ✔ LIGHT01
#> ✔ LIGHT02
#> ✔ LIGHT03

## Visualise value
fct_plot_indic_donut(indicator = datalist[["main"]]$outcome9_2,
iconunicode = "f140") 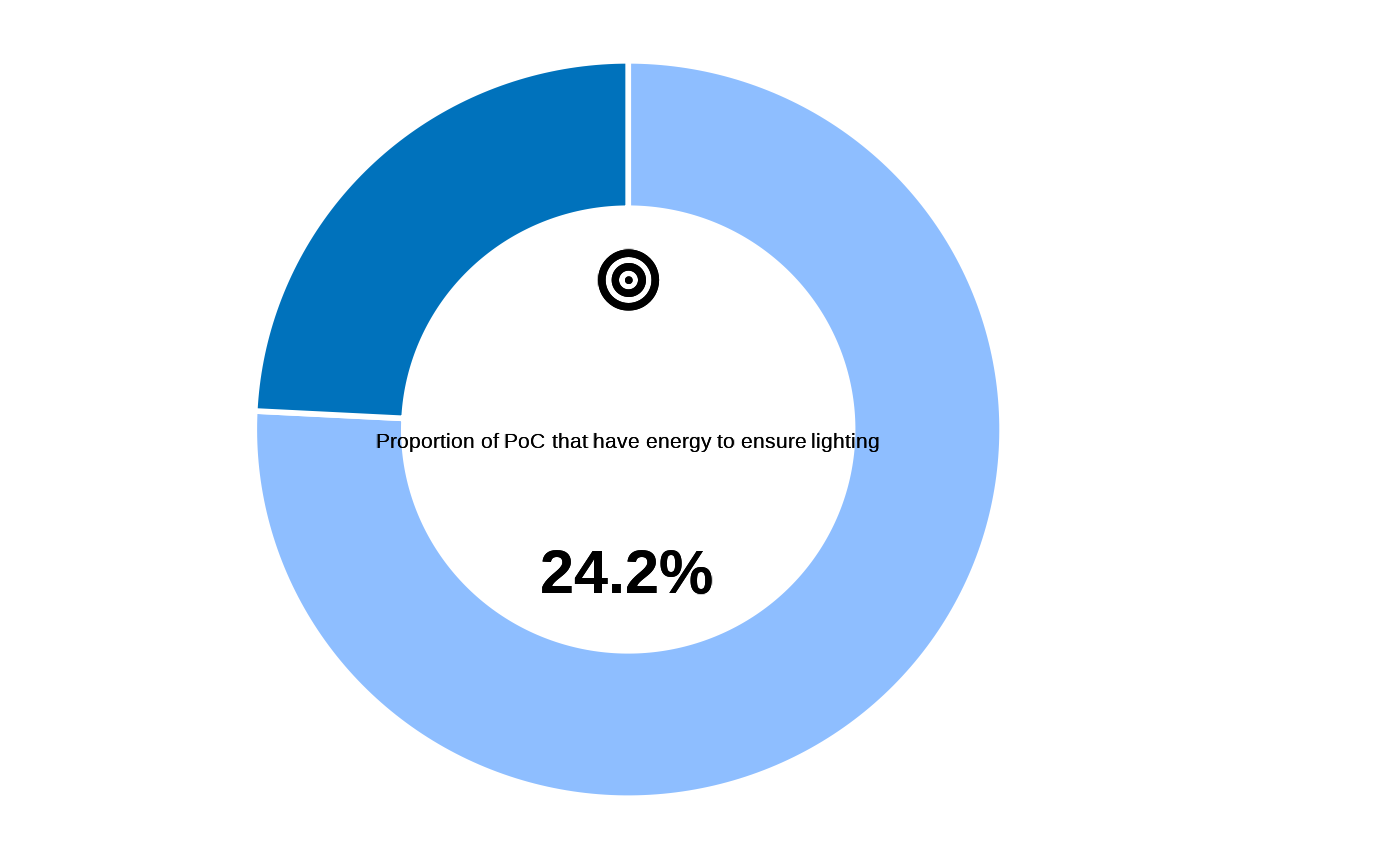
outcome10_1
## data, cf example  fct_re_map()
datalist <- kobocruncher::kobo_data( system.file("dummy_RMS_CAPI_v2_mapped.xlsx",
                                                 package = "IndicatorCalc"))

## Apply indicator function on datalist
datalist <- outcome10_1(datalist)
#> ✔ MMR03

## Visualise value
fct_plot_indic_donut(indicator = datalist[["ind"]]$outcome10_1,
iconunicode = "f140") 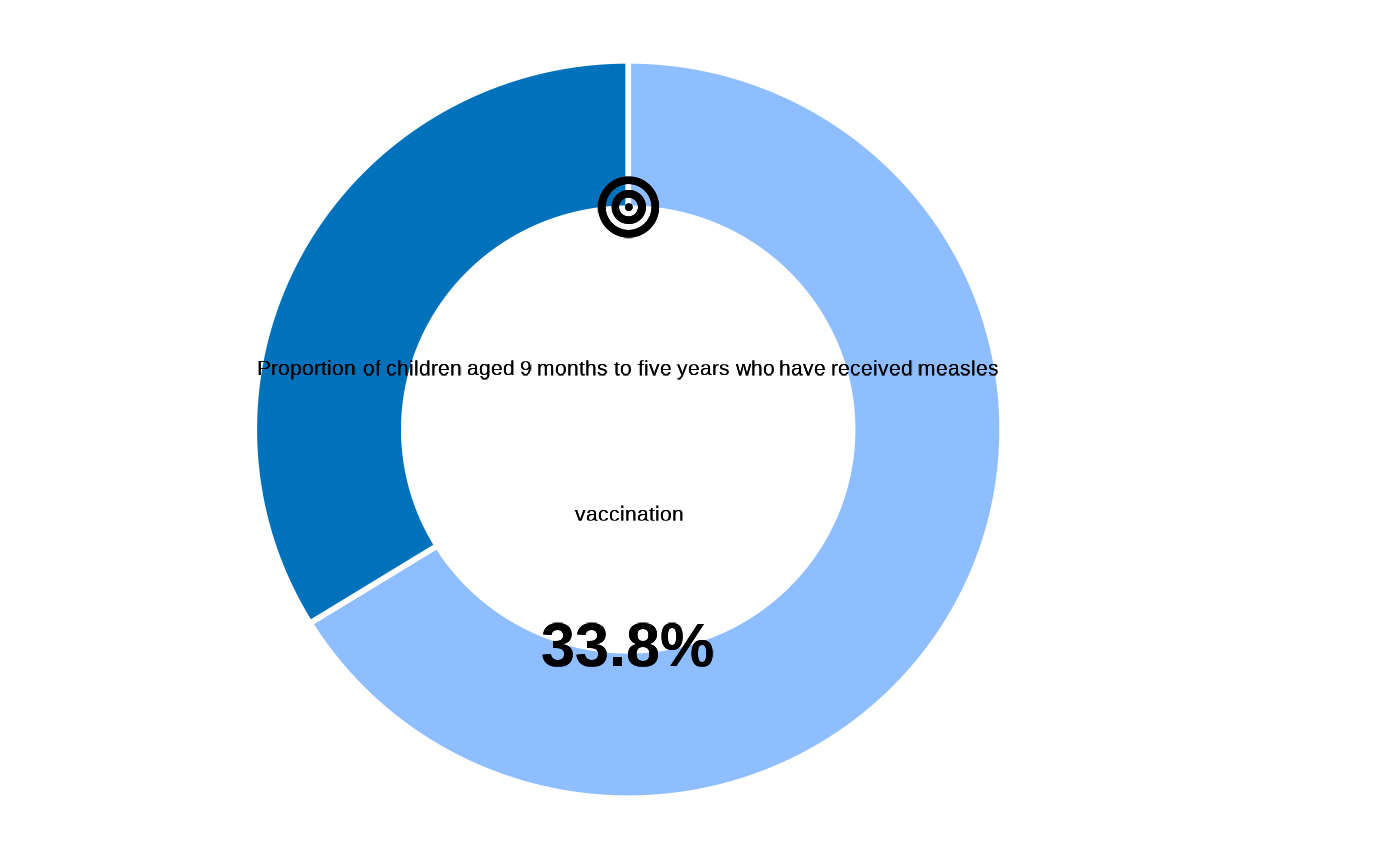
outcome10_2
## data, cf example  fct_re_map()
datalist <- kobocruncher::kobo_data( system.file("dummy_RMS_CAPI_v2_mapped.xlsx",
                                                 package = "IndicatorCalc"))
## Apply indicator function on datalist
datalist <- outcome10_2(datalist  )
#> ✔ BIR01
#> ✔ BIR02
#> ✔ BIR03
#> ✔ BIR04

## Visualise value
fct_plot_indic_donut(indicator = datalist[["main"]]$outcome10_2,
iconunicode = "f140") 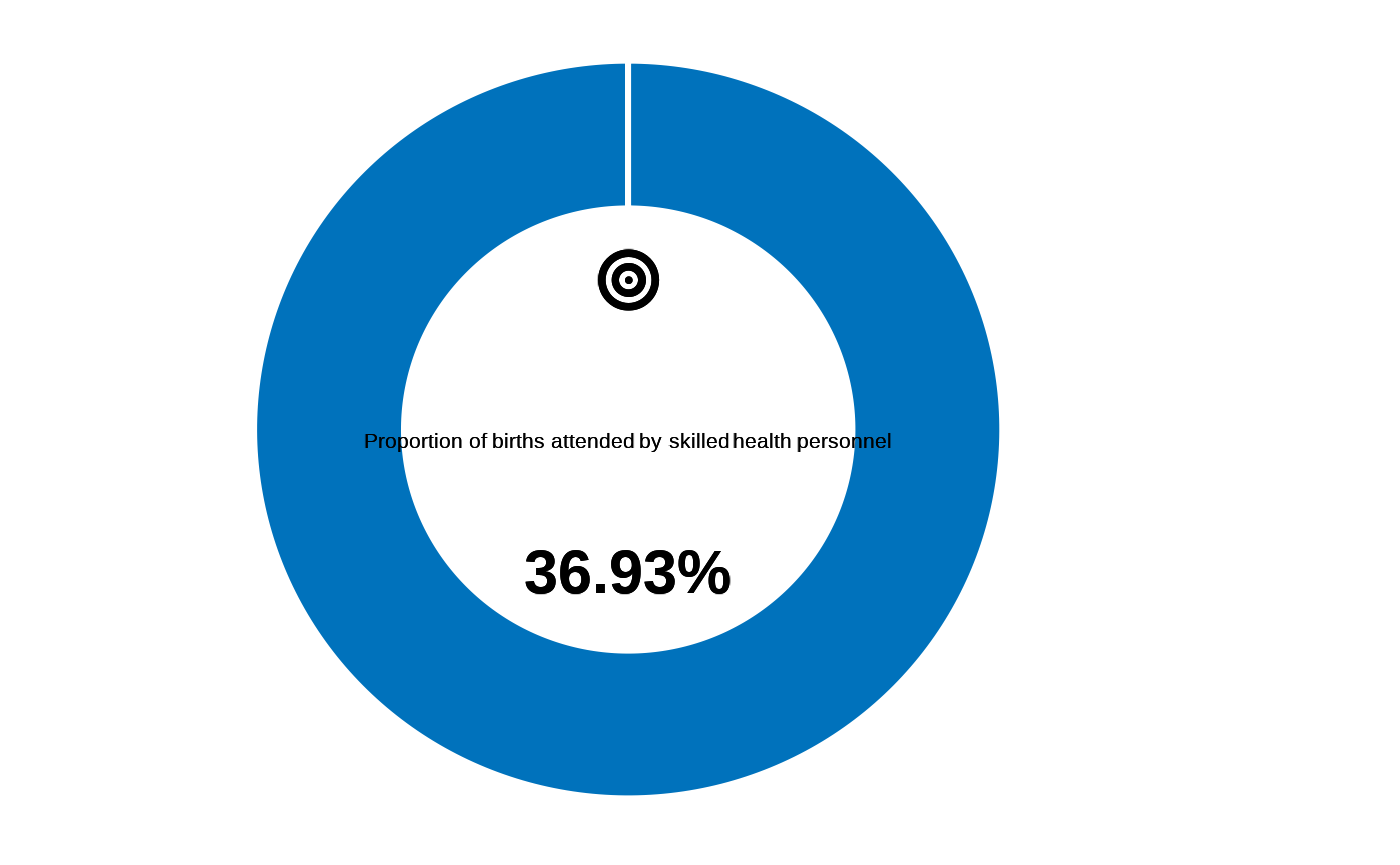
outcome12_1
## data, cf example  fct_re_map()
datalist <- kobocruncher::kobo_data( system.file("dummy_RMS_CAPI_v2_mapped.xlsx",
                                                 package = "IndicatorCalc"))
## Apply indicator function on datalist
datalist <- outcome12_1(datalist  )
#> ✔ DWA01
#> ✔ DWA02
#> ✔ DWA03a
#> ✔ DWA03b
#> ✔ DWA04

## Visualise value
fct_plot_indic_donut(indicator = datalist[["main"]]$outcome12_1,
iconunicode = "f140") 
outcome12_2
## data, cf example  fct_re_map()
datalist <- kobocruncher::kobo_data( system.file("dummy_RMS_CAPI_v2_mapped.xlsx",
                                                 package = "IndicatorCalc"))
## Apply indicator function on datalist
datalist <- outcome12_2(datalist)
#> ✔ TOI01
#> ✔ TOI02
#> ✖ TOI03 not found in the dataset.
#> ✖ TOI04 not found in the dataset.
#> ✖ TOI05 not found in the dataset.
#> There are missing data requirement to calculate Indicator Outcome 12.2

## Visualise value
fct_plot_indic_donut(indicator = datalist[["main"]]$outcome12_2,
                     iconunicode = "f140")
#> No value was supplied for plotting...
outcome13_1
## data, cf example  fct_re_map()
datalist <- kobocruncher::kobo_data( system.file("dummy_RMS_CAPI_v2_mapped.xlsx",
                                                 package = "IndicatorCalc"))
## Apply indicator function on datalist
datalist <- outcome13_1(datalist )
#> ✔ BANK01
#> ✔ BANK02
#> ✔ BANK03
#> ✔ BANK04
#> ✔ BANK05

## Visualise value
fct_plot_indic_donut(indicator = datalist[["main"]]$outcome13_1,
iconunicode = "f140") 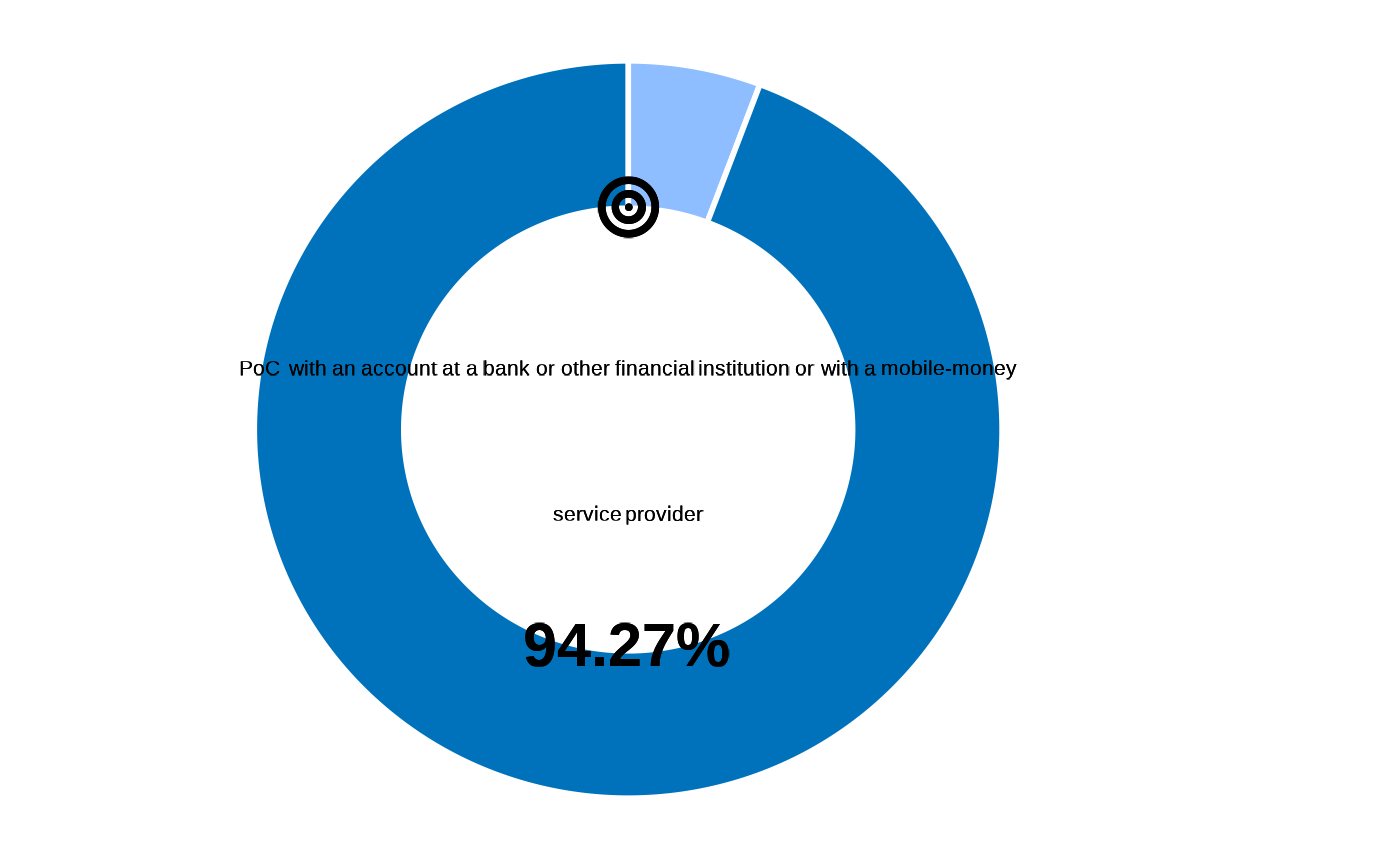
outcome13_2
## data, cf example  fct_re_map()
datalist <- kobocruncher::kobo_data( system.file("dummy_RMS_CAPI_v2_mapped.xlsx",
                                                 package = "IndicatorCalc"))
## Apply indicator function on datalist
datalist <- outcome13_2(datalist)
#> ✔ INC01

## Visualise value
fct_plot_indic_donut(indicator = datalist[["main"]]$outcome13_2,
iconunicode = "f140") 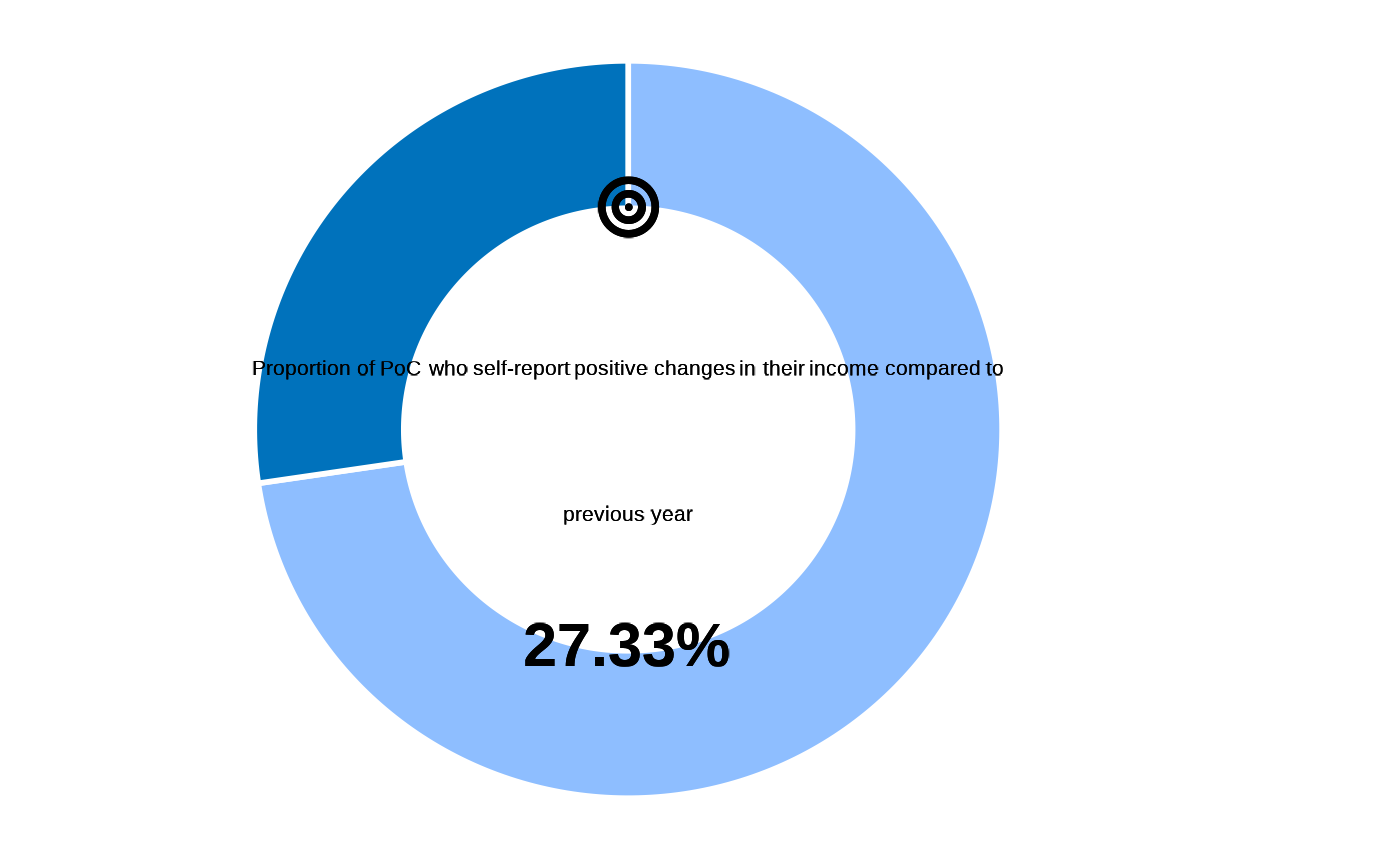
outcome13_3
## data, cf example  fct_re_map()
datalist <- kobocruncher::kobo_data( system.file("dummy_RMS_CAPI_v2_mapped.xlsx",
                                                 package = "IndicatorCalc"))
## Apply indicator function on datalist
datalist <- outcome13_3(datalist )
#> ✔ UNEM01
#> ✔ UNEM02
#> ✔ UNEM03
#> ✔ UNEM04
#> ✔ UNEM05
#> ✔ UNEM06
#> ✔ UNEM07
#> ✔ UNEM08
#> ✔ UNEM09
#> ✔ UNEM10

table( datalist[["main"]]$outcome13_3, useNA = "ifany")
#>
#>    0    1 <NA>
#> 1298   51  151
## Visualise value
fct_plot_indic_donut(indicator = datalist[["main"]]$outcome13_3,
iconunicode = "f140") 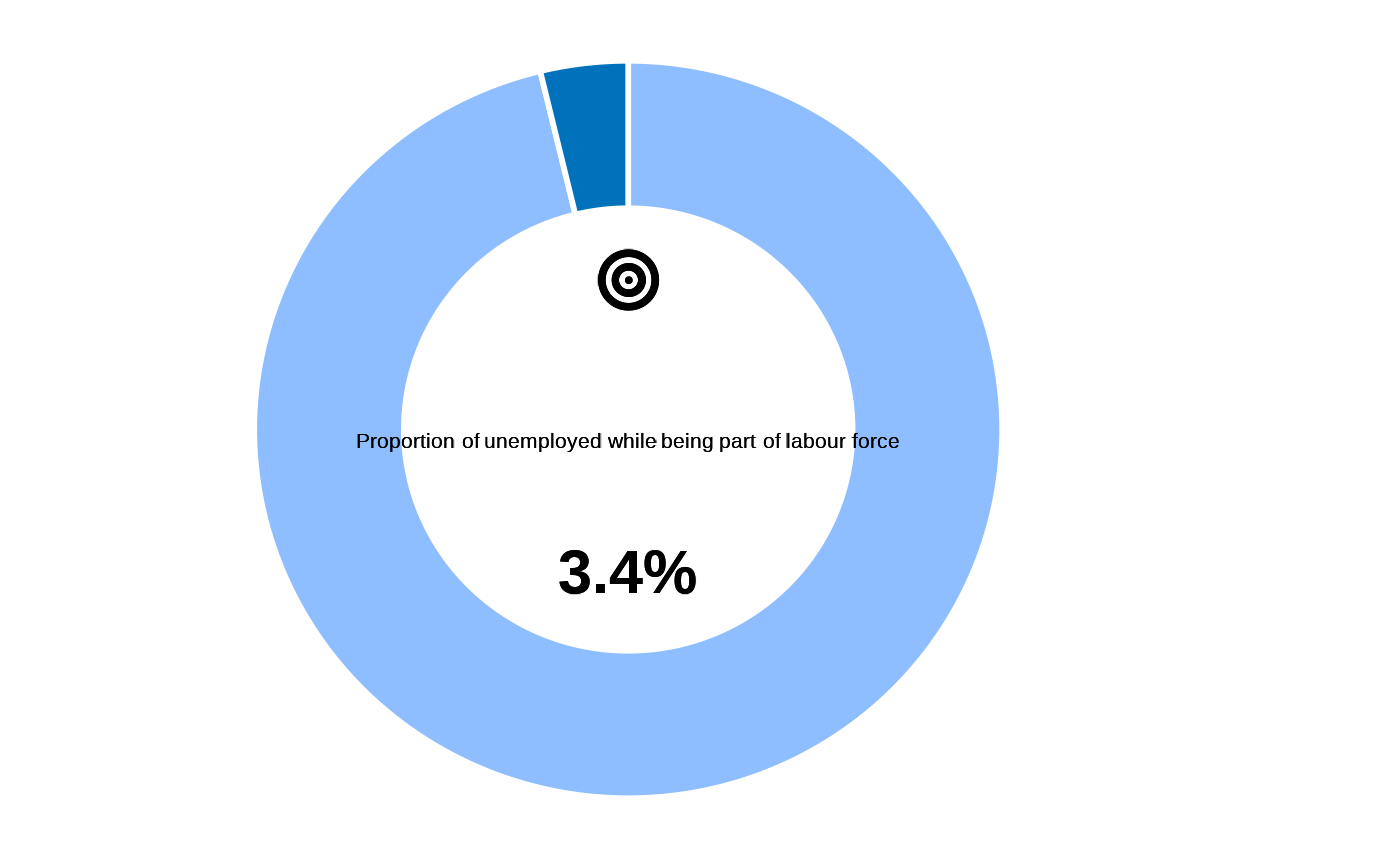
outcome14_1
## data, cf example  fct_re_map()
datalist <- kobocruncher::kobo_data( system.file("dummy_RMS_CAPI_v2_mapped.xlsx",
                                                 package = "IndicatorCalc"))

## Apply indicator function on datalist
datalist <- outcome14_1(datalist )
#> ✔ REG01a
#> ✔ REG01b
#> ✔ REG01c
#> ✔ REG01d
#> ✔ REG01e
#> ✔ REG01f
#> ✔ REG01g
#> ✔ REG02
#> ✔ REG03
#> ✔ REG04
#> ✔ REG05a
#> ✔ REG05b
#> ✔ REG05c
#> ✔ REG05d
#> ✔ REG05e
#> ✔ REG05f
#> ✔ REG06

## Visualise value
fct_plot_indic_donut(indicator = datalist[["ind"]]$outcome14_1,
iconunicode = "f140") 
outcome16_1
## data, cf example  fct_re_map()
datalist <- kobocruncher::kobo_data( system.file("dummy_RMS_CAPI_v2_mapped.xlsx",
                                                 package = "IndicatorCalc"))

## Apply indicator function on datalist
datalist <- outcome16_1(datalist )
#> ✔ DWE06
#> ✔ DWE07
#> ✔ DWE10
#> ✔ DWE11

## Visualise value
fct_plot_indic_donut(indicator = datalist[["main"]]$outcome16_1,
iconunicode = "f140") 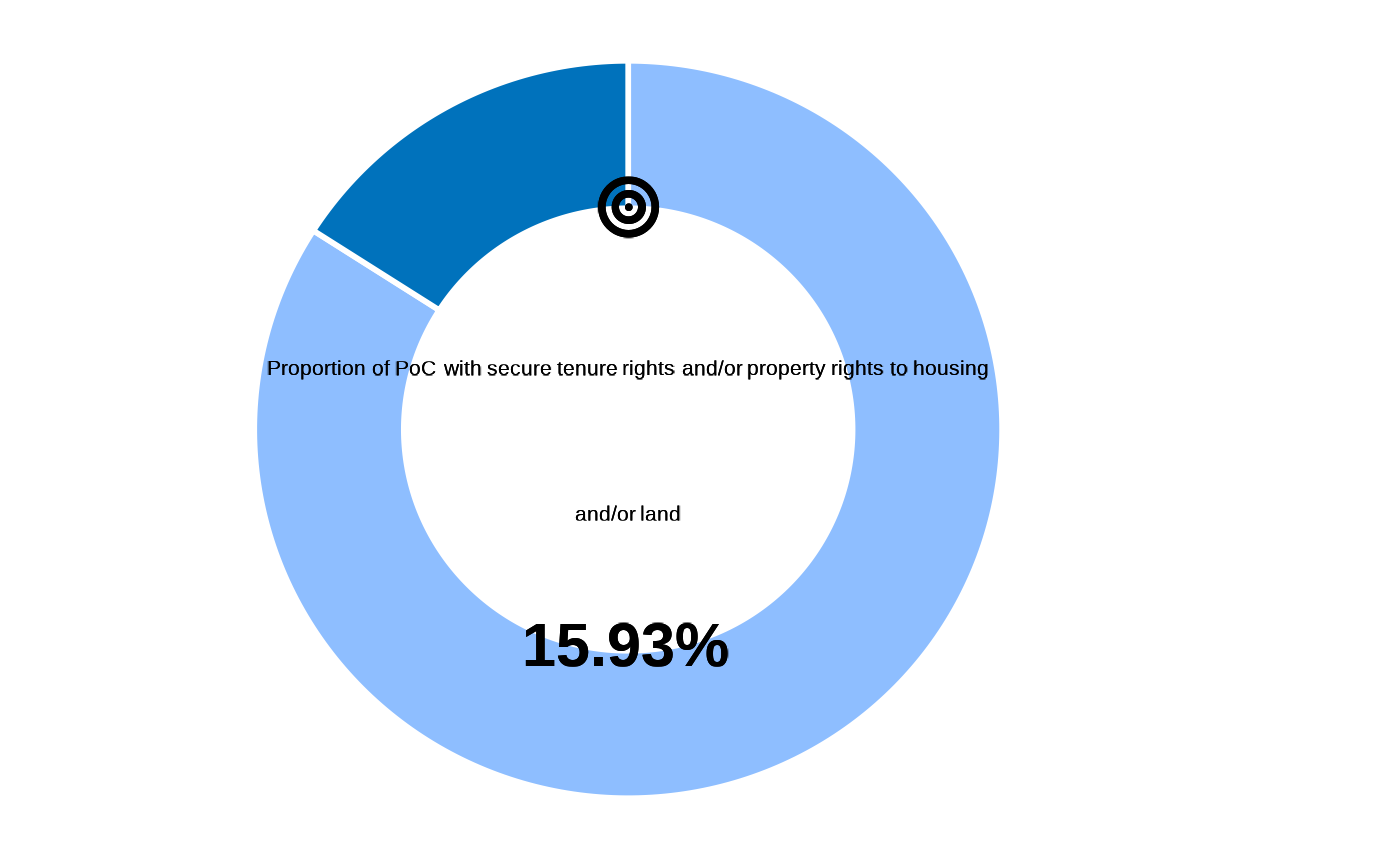
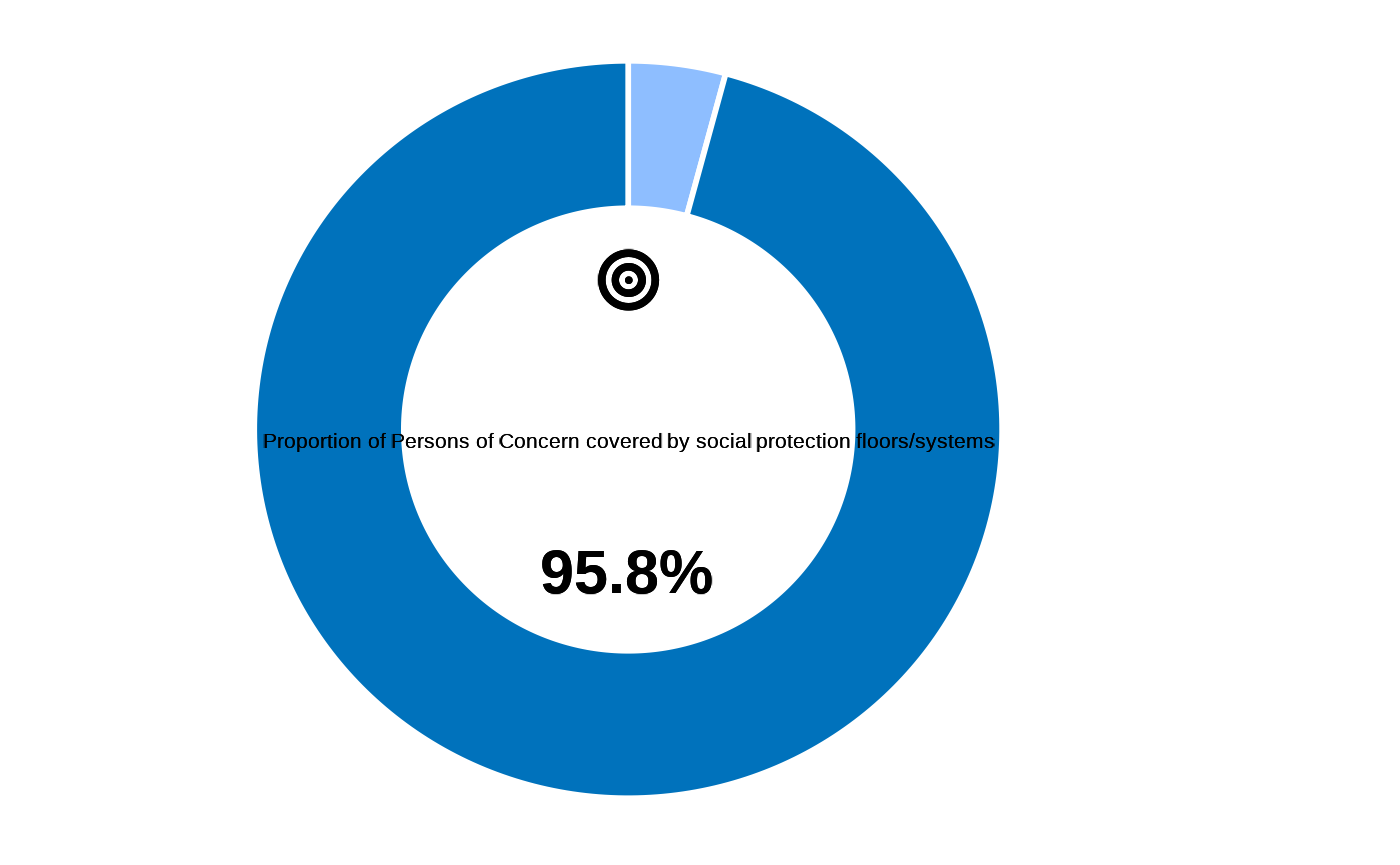
outcome16_2
## data, cf example  fct_re_map()
datalist <- kobocruncher::kobo_data( system.file("dummy_RMS_CAPI_v2_mapped.xlsx",
                                                 package = "IndicatorCalc"))
## Apply indicator function on datalist
datalist <- outcome16_2(datalist)
#> ✔ SPF01a
#> ✔ SPF01b
#> ✔ SPF01c
#> ✔ SPF01d
#> ✔ SPF01e
#> ✔ SPF01f
#> ✔ SPF01g
#> ✔ SPF01h

table( datalist[["main"]]$outcome16_2, useNA = "ifany")
#>
#>    0    1
#>   63 1437
## Visualise value
fct_plot_indic_donut(indicator = datalist[["main"]]$outcome16_2,
                     iconunicode = "f140")