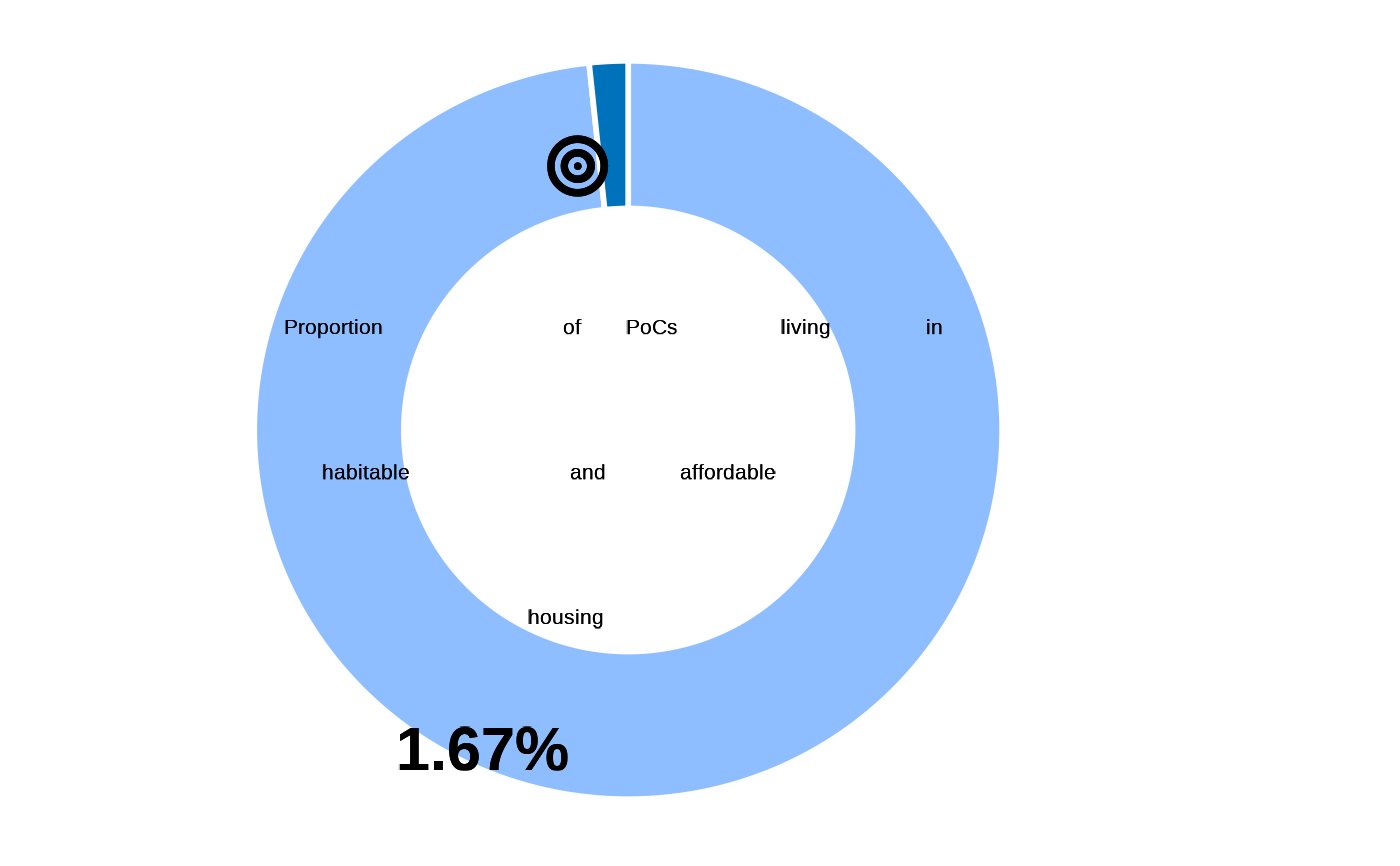
Proportion of Persons of Concern living in habitable and affordable housing
Arguments
- datalist
A list with all hierarchical data frame for a survey data set. format is expected to match the Excel export synchronized from kobo to RILD and loaded with kobocruncher::kobo_data()
Details
This indicator measures the proportion of persons of concern living in habitable and affordable housing. This indicator focuses only on habitability and affordability. It is limited in its reflection on other key aspects of adequate housing including security of tenure, availability of other basic services and infrastructure, accessibility, location of housing, and cultural appropriateness. It is also linked to SGD indicator 11.1.1.
The right to access adequate housing is protected by international law. The concept of "adequacy" means that housing is more than four walls and a roof as indicated in The Sphere Handbook. Habitable housing primarily refers to the fact that the housing should provide protection from cold, damp, heat, rain, wind, and other threats to health, structural hazards, and disease vectors and it should not be overcrowded. As shelter/housing is primarily a contextual element, there may be discrepancies from country to country on how this data is measured.Habitable shelter is measured based on having improved material for the dwelling as indicated in DHS publication on housing conditions which is also used by MICS6. Overcrowding is also used which occurs if there are more than three people per habitable room as defined by UN-Habitat.
Affordable housing refers to the fact that the cost of housing and its related expenditures on maintenance and household items should be at such a level that it should not compromise the attainment and satisfaction of other basic needs
| Standard Questions |
| DWE01-DWE05 & DWE08-DWE09 |
Numerator: Total population living in habitable and affordable housing
Denominator: Total population
Formula: DWE01 = 1,2 & DWE02 = 3,4,5,6,7,8,9 & DWE03 = 8,9,10,11,12,13 & DWE04 = 10,11,12,13,14,15 & crowding (HH01/DWE05) \<= 3 & (DWE08=1 & DWE09=1,2) \| DWE08=0
This indicator is calculated from the main dataset
classify as habitable when improved/adequate shelter
Examples
## data, cf example  fct_re_map()
datalist <- kobocruncher::kobo_data( system.file("dummy_RMS_CAPI_v2_mapped.xlsx",
                                                 package = "IndicatorCalc"))
#> Warning: Unknown or uninitialised column: `_parent_index`.
## Apply indicator function on datalist
datalist <- outcome9_1(datalist)
#> ✔ DWE01
#> ✔ DWE02
#> ✔ DWE03
#> ✔ DWE04
#> ✔ DWE05
#> ✔ DWE08
#> ✔ DWE09
#> ✔ HH01

## Visualise value
fct_plot_indic_donut(indicator = datalist[["main"]]$outcome9_1,
                     iconunicode = "f140")