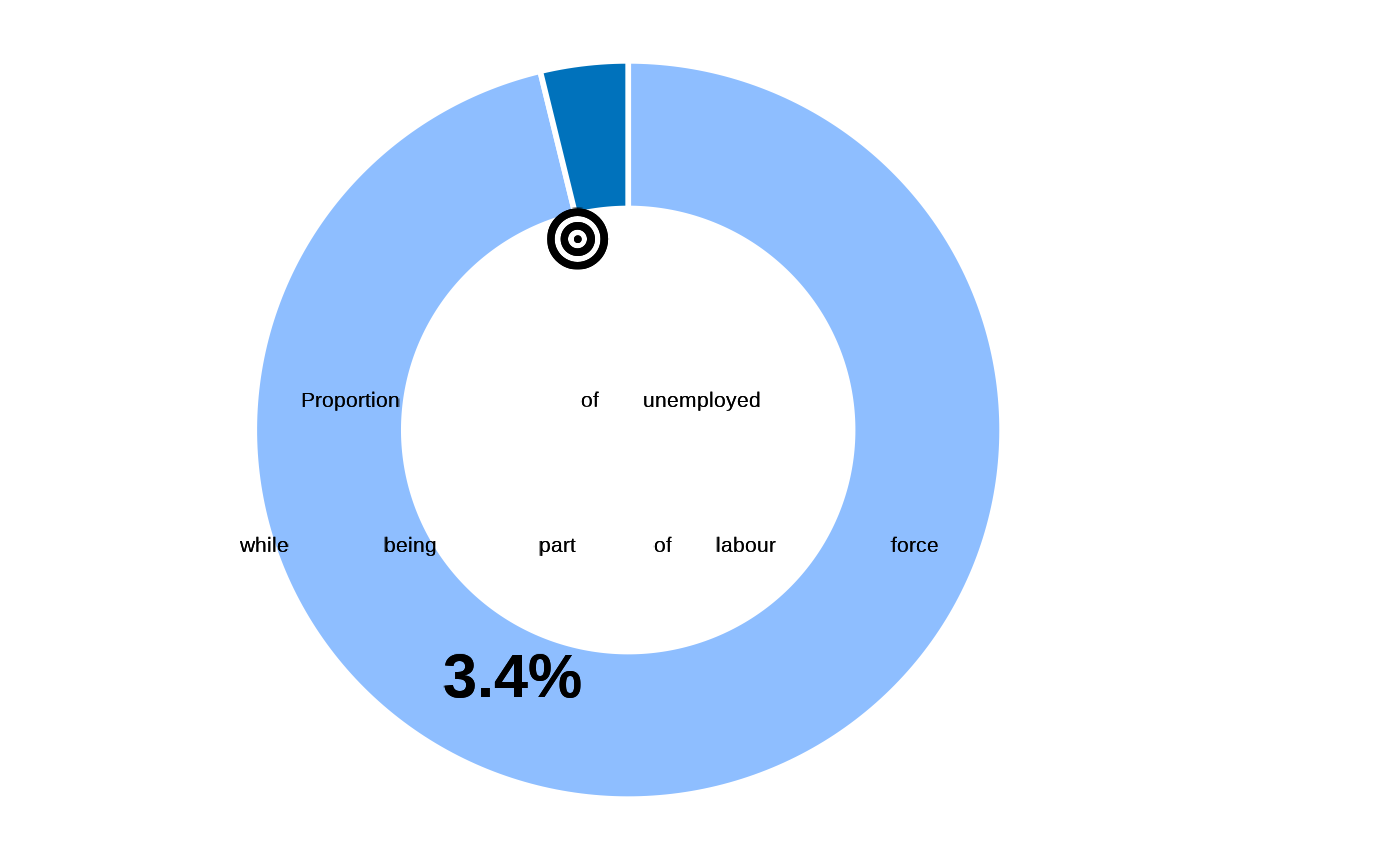
Proportion of Persons of Concern (working age) who are unemployed The unemployment rate is a standard indicator to measure the efficiency and effectiveness of an economy. For Persons of Concern, access to employment is central for self-reliance, socio-economic inclusion and dignity and often restricted through laws, policies or practical barriers. This indicator is also linked to SGD 8.5.2. The standard questionnaire module is from Standardized Employment Module of UNHCR. The calculations are also done based on the same guidance.
| Standard Questions |
| UNEM01-UNEM10 |
Arguments
- datalist
A list with all hierarchical data frame for a survey data set. format is expected to match the Excel export synchronized from kobo to RILD and loaded with kobocruncher::kobo_data()
Details
Numerator: Unemployed working age population within a country
Denominator: Total working age population who are employed and unemployed within a country (often referred to as labour force)
Formula: UNEM01=1 \| (UNEM02=1 & UNEM07=3) \| UNEM04=1 \| (UNEM02=1 & UNEM07=1 &( UNEM08=1,2)) \|(UNEM05=1 & UNEM06=3) \| ( UNEM05=1 & ( UNEM06=1,2 \| UNEM08=1,2) This indicator comes from main dataset based on the respondent randomly selected for individual level
#Numerator: Those of working age who were not in employment, looked for employment in the past 30 days and were available to take up employment
Examples
## data, cf example  fct_re_map()
datalist <- kobocruncher::kobo_data( system.file("dummy_RMS_CAPI_v2_mapped.xlsx",
                                                 package = "IndicatorCalc"))
#> Warning: Unknown or uninitialised column: `_parent_index`.
## Apply indicator function on datalist
datalist <- outcome13_3(datalist )
#> ✔ UNEM01
#> ✔ UNEM02
#> ✔ UNEM03
#> ✔ UNEM04
#> ✔ UNEM05
#> ✔ UNEM06
#> ✔ UNEM07
#> ✔ UNEM08
#> ✔ UNEM09
#> ✔ UNEM10

table( datalist[["main"]]$outcome13_3, useNA = "ifany")
#>
#>    0    1 <NA>
#> 1298   51  151
## Visualise value
fct_plot_indic_donut(indicator = datalist[["main"]]$outcome13_3,
                     iconunicode = "f140")