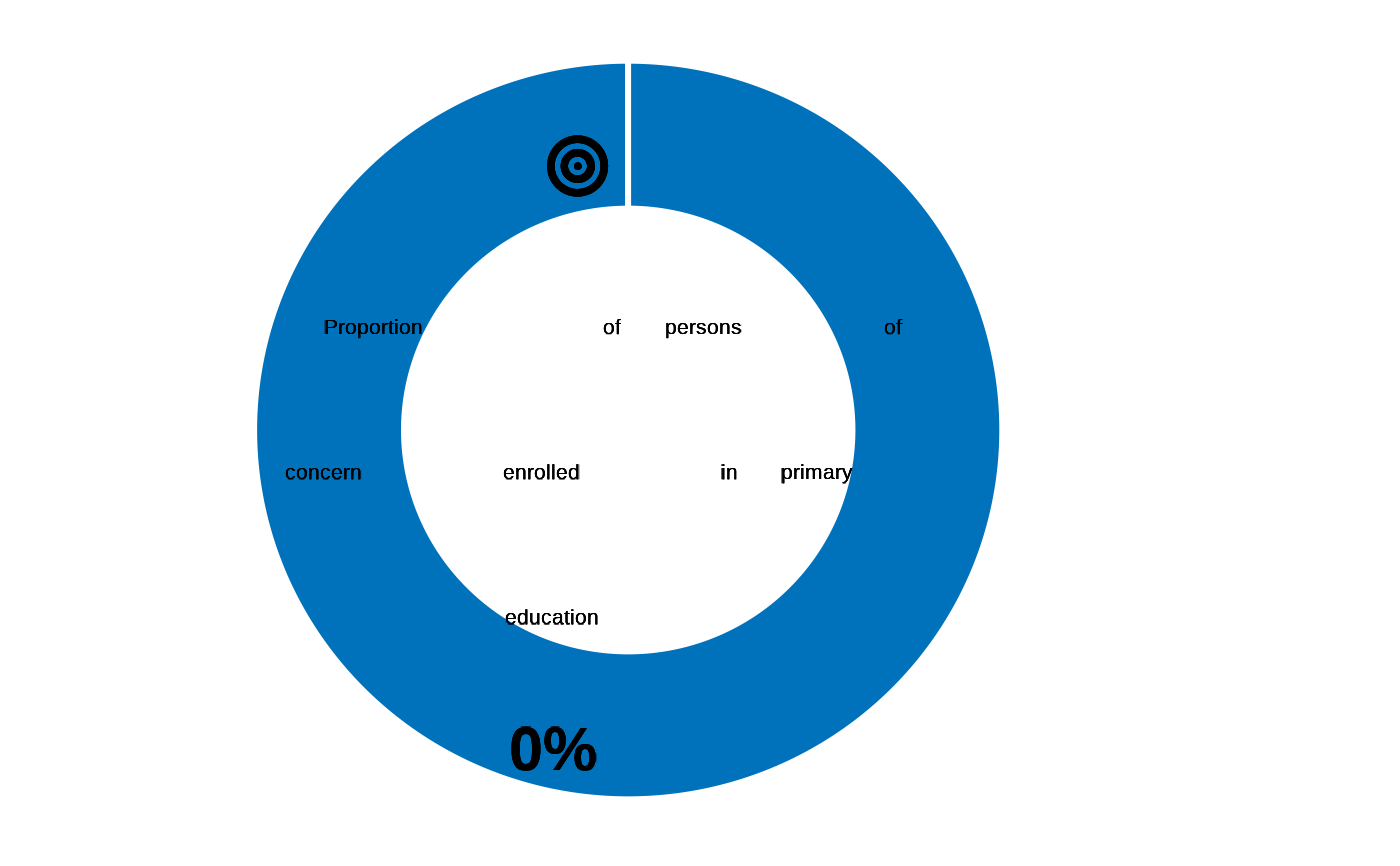
Proportion of Persons of Concern enrolled in primary education
This indicator measures the number of students enrolled in primary education, regardless of age, expressed as a percentage of the official school-age population corresponding to the respective same level of education.
This is also referred to as Gross enrollment rate (GER).
It is linked to SGD indicator 4.1.1 on quality education.
The standard questions for this indicator are taken from UNHCR's Standardized Education Module which are adapted primarily from the IHSN/EPDC and MICS indicator and questionnaire frameworks.
Definitions:
"Enrollment" refers individuals officially registered in a primary/secondary school education programme.
"Primary education" is designed to provide students with fundamental skills in reading, writing and mathematics.
Duration typically varies from 4 to 7 years. The most common duration is 6 years. It corresponds to ISCED (International Standard Classification of Education) level 1.
"Primary school age" depends on the education system and it varies from country to country. Children typically enter in primary education between age 5 and 7 and leave at the age of 10 and 12.
| Standard Questions |
| EDU01-EDU04 |
Numerator: Population enrolled in primary education (regardless of age) Denominator: Total primary school age population (to be adjusted by the country for enumeration)
Formula: (EDU01=1 & EDU02=1 & EDU03=2) / Number of children aged from 6 to 10
Arguments
- datalist
A list with all hierarchical data frame for a survey data set. format is expected to match the Excel export synchronized from kobo to RILD and loaded with kobocruncher::kobo_data()
Examples
## data, cf example  fct_re_map()
datalist <- kobocruncher::kobo_data( system.file("dummy_RMS_CAPI_v2_mapped.xlsx",
                                                 package = "IndicatorCalc"))
#> Warning: Unknown or uninitialised column: `_parent_index`.
## Apply calculation
datalist <- impact3_2a(datalist  )
#> ✔ EDU01
#> ✔ EDU02
#> ✔ EDU03
#> ✔ EDU04
#> ✔ HH07
table(datalist[["ind"]]$impact3_2a, useNA = "ifany")
#>
#> 0.717948717948718
#>              1500
table(datalist[["ind"]]$edu_primary, useNA = "ifany")
#>
#>    0    1
#> 1444   56
table(datalist[["ind"]]$age_primary, useNA = "ifany")
#>
#>    1 <NA>
#>   78 1422

## Visualise value
fct_plot_indic_donut(indicator = datalist[["ind"]]$impact3_2a,
                     iconunicode = "f140")
