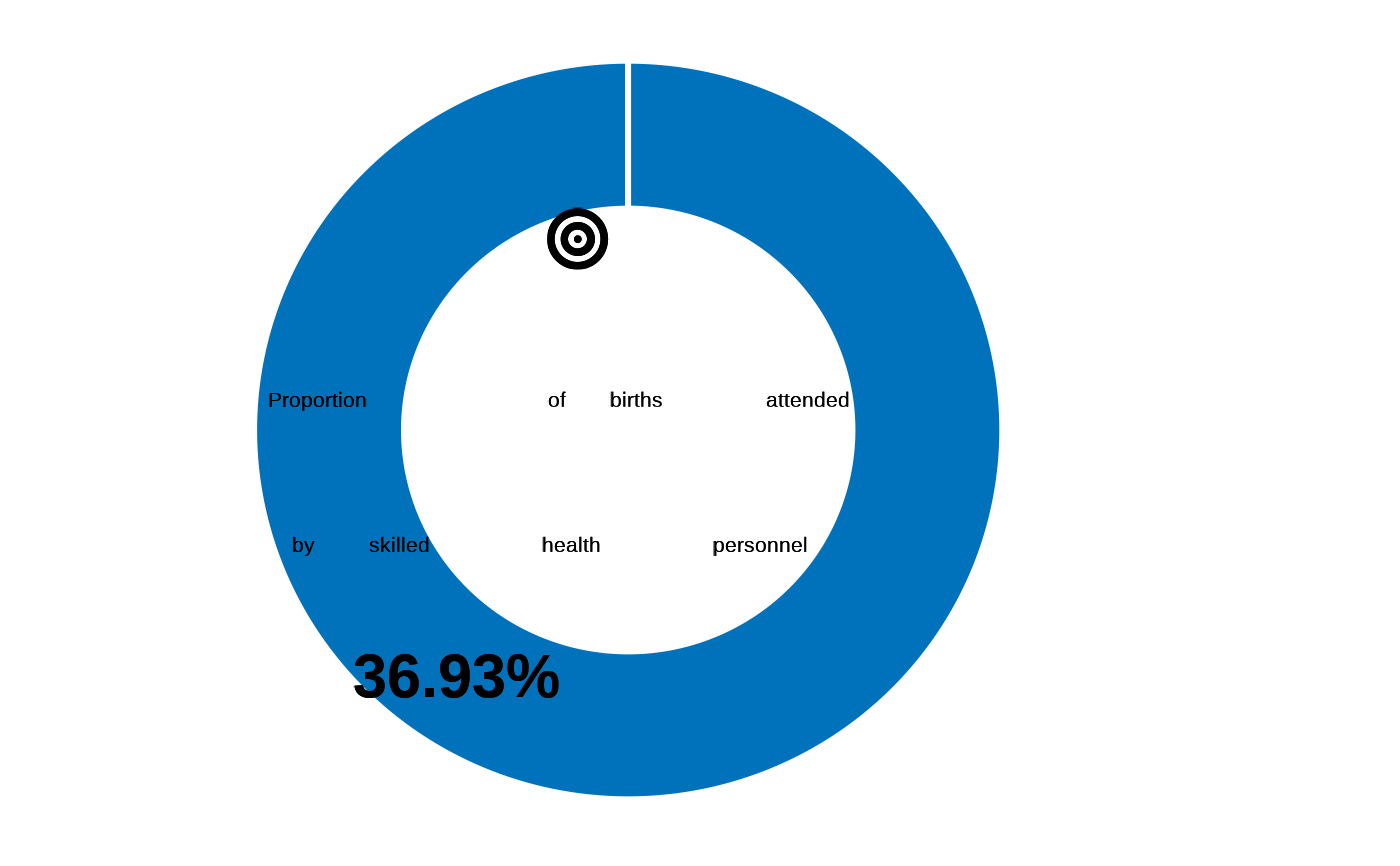
Proportion of births attended by skilled health personnel
Arguments
- datalist
A list with all hierarchical data frame for a survey data set. format is expected to match the Excel export synchronized from kobo to RILD and loaded with kobocruncher::kobo_data()
Details
This indicator measures the percentage of births attended by personnel trained to give the necessary supervision, care, and advice to women during pregnancy, labor, and the postpartum period; to conduct deliveries on their own; and to care for newborns. This indicator is linked to SGD 3.1.2.
National-level household surveys are the main data sources used to collect data for skilled health personnel providing childbirth care. These surveys include Demographic and Health Surveys (DHS), Multiple Indicator Cluster Surveys (MICS), Reproductive Health Surveys (RHS) and other national surveys based on similar methodologies. Standard module is from UNICEF MICS6 individual questionnaire for woman. The calculation of this module is also aligned with UNICEF MICS6.
The national categories of skilled health personnel are verified, and the estimates for some countries may include additional categories of trained personnel beyond doctor, nurse, and midwife.
| Standard Questions |
| BIR01-BIR04 |
Numerator: Total number of births attended by skilled health personnel)
Denominator: Total number of live births
Formula: (BIR01=1 | BIR02=1) & (BIR03=1,2,3) / Total number of live births This comes from the main dataset MICS TM.5.a UNICEF MICS calculation if there was a trained health personnel ## If there are live births in the last 2 years Traditional birth attendant and community health worker can be included if they are trained
Examples
## data, cf example  fct_re_map()
datalist <- kobocruncher::kobo_data( system.file("dummy_RMS_CAPI_v2_mapped.xlsx",
                                                 package = "IndicatorCalc"))
#> Warning: Unknown or uninitialised column: `_parent_index`.
## Apply indicator function on datalist
datalist <- outcome10_2(datalist  )
#> ✔ BIR01
#> ✔ BIR02
#> ✔ BIR03
#> ✔ BIR04

## Visualise value
fct_plot_indic_donut(indicator = datalist[["main"]]$outcome10_2,
                     iconunicode = "f140")