Proportion of Persons of Concern with legally recognized identity documents or credentials
Arguments
- datalist
A list with all hierarchical data frame for a survey data set. format is expected to match the Excel export synchronized from kobo to RILD and loaded with kobocruncher::kobo_data()
Details
This indicator measures the proportion of persons of concern who possess legally recognized and valid identity documents or credentials.
Establishing one's identity and possessing legally recognized and valid identity documents or credentials ensures the legal protection of persons of concern, protection from refoulement, registration of life events to prevent statelessness, as well as access to services.
Definitions
Identity document or credential is any document or credential which may be
used as proof of identity, which may also include reference to the
 individuals' legal status and associated rights vis-à-vis the host
State and/or UNHCR.| Standard Questions |
| REG01 - REG02 - REG03 / REG05 - REG06 |
Numerator: Total population with valid identity documents or credentials
Denominator: Total population
Formula: ( REG01=1 \| REG02=1 \| REG03=1 \| REG05=1 \| REG06=1) / Total population
This indicator comes from the individual dataset - Calculate valid identity documents for under 5 with REG05 and REG06 variables ind$REG05a - passport ind$REG05b - civil/government issued ID ind$REG05c - residency permit ind$REG05d - statelessness documentation ind$REG05e - household card of address/family book ind$REG05f - social security card ind$REG06 - any other document establishes identity add birth certificate as additional document from REG03
Examples
## data, cf example fct_re_map()
datalist <- kobocruncher::kobo_data( system.file("dummy_RMS_CAPI_v2_mapped.xlsx",
package = "IndicatorCalc"))
#> Warning: Unknown or uninitialised column: `_parent_index`.
## Apply indicator function on datalist
datalist <- outcome1_3(datalist)
#> ✔ REG01a
#> ✔ REG01b
#> ✔ REG01c
#> ✔ REG01d
#> ✔ REG01e
#> ✔ REG01f
#> ✔ REG01g
#> ✔ REG02
#> ✔ REG03
#> ✔ REG05a
#> ✔ REG05b
#> ✔ REG05c
#> ✔ REG05d
#> ✔ REG05e
#> ✔ REG05f
#> ✔ REG06
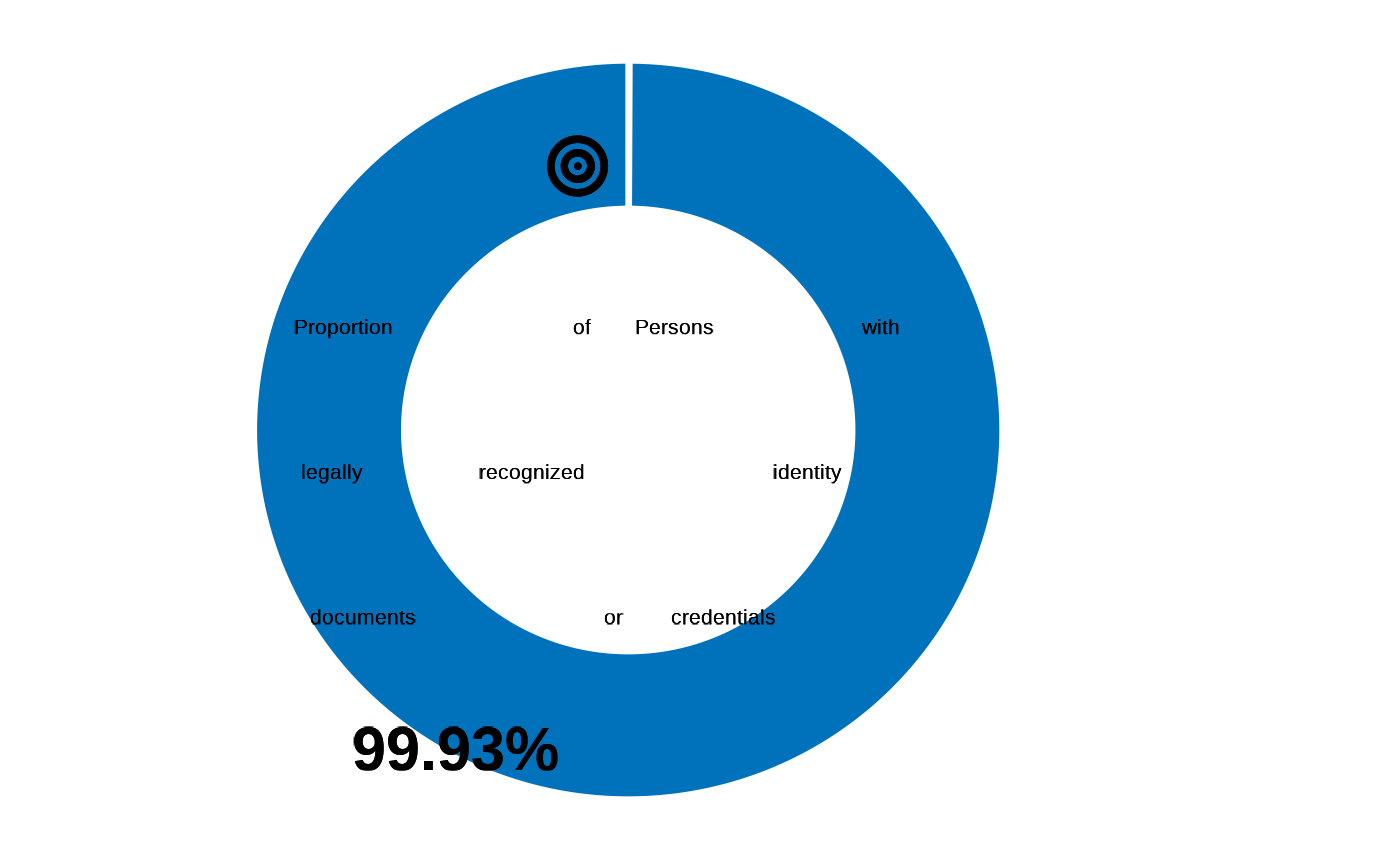
## Visualise value
fct_plot_indic_donut(indicator = datalist[["ind"]]$outcome1_3,
iconunicode = "f140")
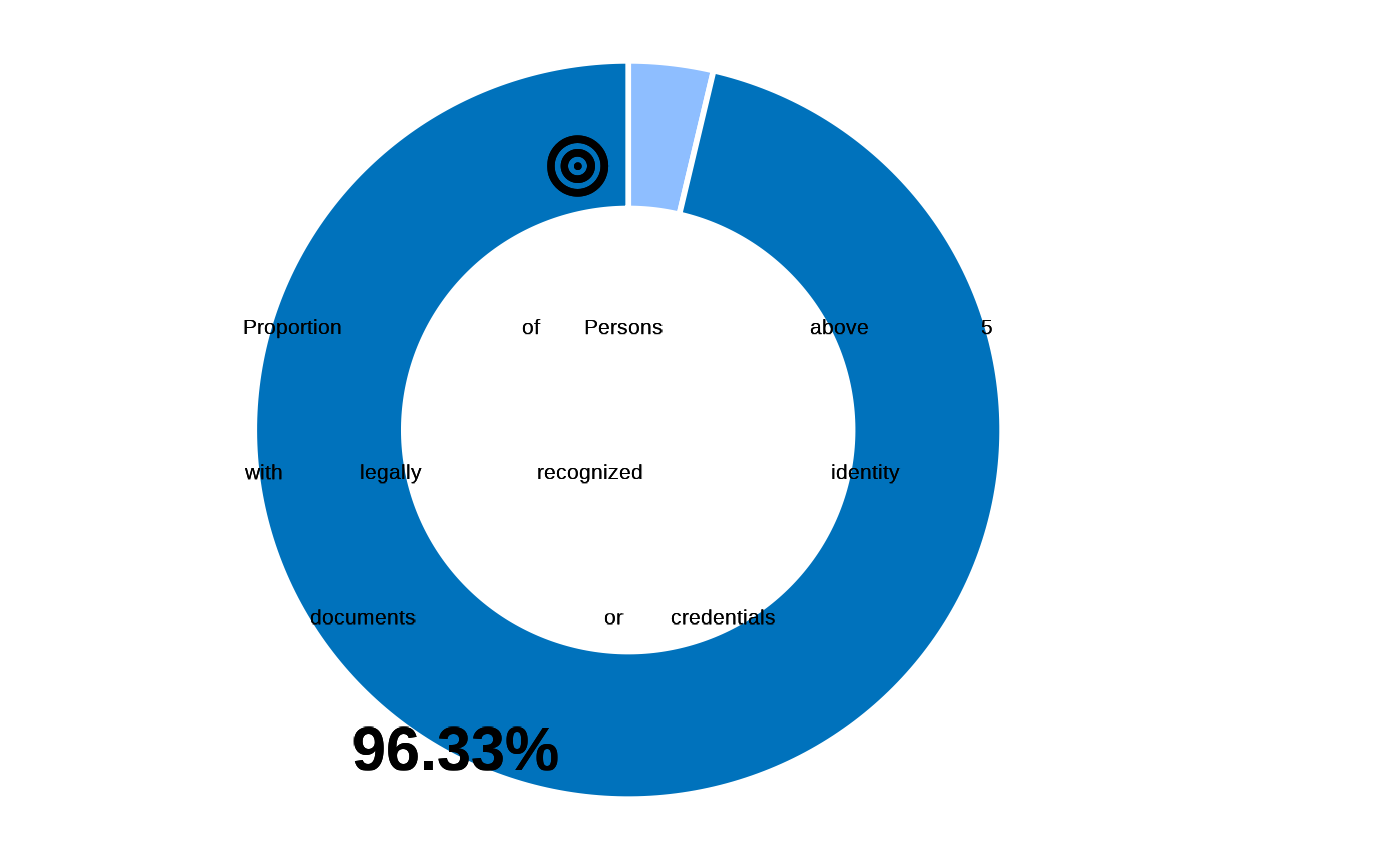
 fct_plot_indic_donut(indicator = datalist[["ind"]]$document_above5,
iconunicode = "f140")
fct_plot_indic_donut(indicator = datalist[["ind"]]$document_above5,
iconunicode = "f140")
 fct_plot_indic_donut(indicator = datalist[["ind"]]$document_under5,
iconunicode = "f140")
fct_plot_indic_donut(indicator = datalist[["ind"]]$document_under5,
iconunicode = "f140")