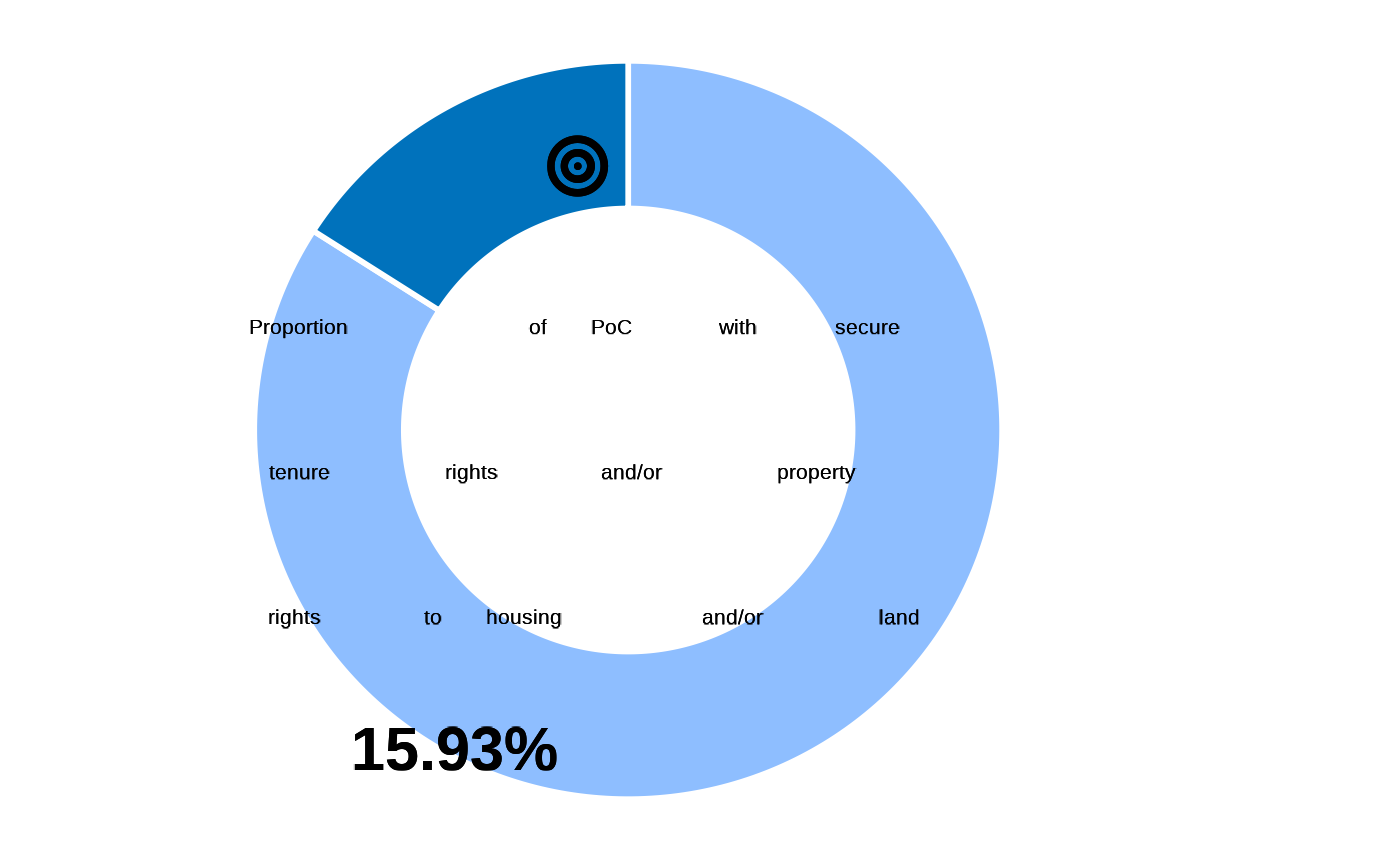
Proportion of Persons of Concern with secure tenure rights and/or property rights to housing and/or land
This indicator measures the proportion of persons of concern that have secure tenure rights to housing and/or land. Security of tenure means that persons of concern can live in their homes without fear of forced eviction, whether in communal settlement situations, informal settlements, host communities or after return.
Arguments
- datalist
A list with all hierarchical data frame for a survey data set. format is expected to match the Excel export synchronized from kobo to RILD and loaded with kobocruncher::kobo_data()
Details
This indicator is linked to SGD Indicator 1.4.2. The further guidance can be found here
Concept
Secure tenure rights: comprised of two sub-components: (i) legally recognized documentation and (ii) perception of the security of tenure, which are both necessary to provide a full measurement of tenure security.
Legally recognized documentation: Legal documentation of rights refers to the recording and publication of information on the nature and location of land, rights and right holders in a form that is recognized by government, and is therefore official.
Perceived security of tenure: Perception of tenure security refers to an individual's perception of the likelihood of involuntary loss of land, such as disagreement of the ownership rights over land or ability to use it, regardless of the formal status and can be more optimistic or pessimistic.
| Standard Questions |
| DWE06-DWE07 & DWE10-DWE11 |
Numerator: Total population with secure tenure rights to housing and/or land
Denominator: Total population Formula: DWE011 = 1,2 & DWE10 = 1,2,3,4,5,6 & DWE06 != 9, 96,98,99 & DWE07 = 9, 96,98,99 This indicator is calculated from the main dataset
Examples
## data, cf example  fct_re_map()
datalist <- kobocruncher::kobo_data( system.file("dummy_RMS_CAPI_v2_mapped.xlsx",
                                                 package = "IndicatorCalc"))
#> Warning: Unknown or uninitialised column: `_parent_index`.

## Apply indicator function on datalist
datalist <- outcome16_1(datalist )
#> ✔ DWE06
#> ✔ DWE07
#> ✔ DWE10
#> ✔ DWE11

## Visualise value
fct_plot_indic_donut(indicator = datalist[["main"]]$outcome16_1,
                     iconunicode = "f140")