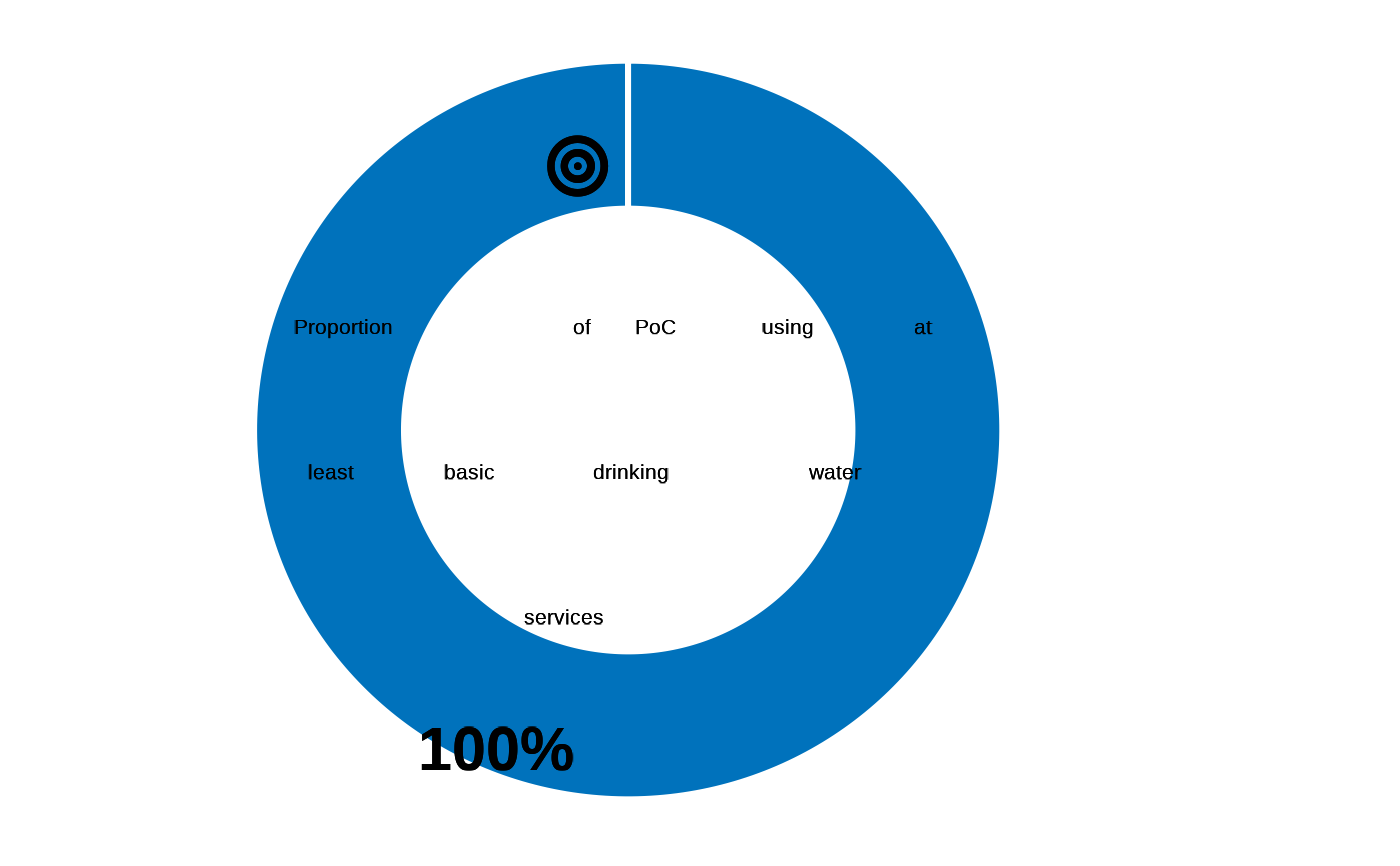
Proportion of Persons of Concern using at least basic drinking water services
Arguments
- datalist
A list with all hierarchical data frame for a survey data set. format is expected to match the Excel export synchronized from kobo to RILD and loaded with kobocruncher::kobo_data()
Details
This indicator is defined as the percentage of PoCs using at least basic water services. Access to clean drinking water is essential for a person's survival and well being and a precursor for achieving protection outcomes related to health, education and economic developed. The calculation for access drinking water is linked to SGD Indicator 6.1.1. The questionnaire module and the analysis guidance is taken from UNICEF MICS6.
| Standard Questions |
| DWA01-DWA04 |
Numerator: Population using improved sources of drinking water either in their dwelling/yard/plot or within 30 minutes round trip collection time
Denominator: Total population
Formula: DWA03 \< 30 (under 30 minutes), & DWA01 !=7,9,13,96,98 & DWA02 !=3
This comes from the main dataset There are two conditions as below improved source, in dwelling/yard/plot or reachable under 30 minutes
Examples
## data, cf example  fct_re_map()
datalist <- kobocruncher::kobo_data( system.file("dummy_RMS_CAPI_v2_mapped.xlsx",
                                                 package = "IndicatorCalc"))
#> Warning: Unknown or uninitialised column: `_parent_index`.
## Apply indicator function on datalist
datalist <- outcome12_1(datalist  )
#> ✔ DWA01
#> ✔ DWA02
#> ✔ DWA03a
#> ✔ DWA03b
#> ✔ DWA04

## Visualise value
fct_plot_indic_donut(indicator = datalist[["main"]]$outcome12_1,
                     iconunicode = "f140")
