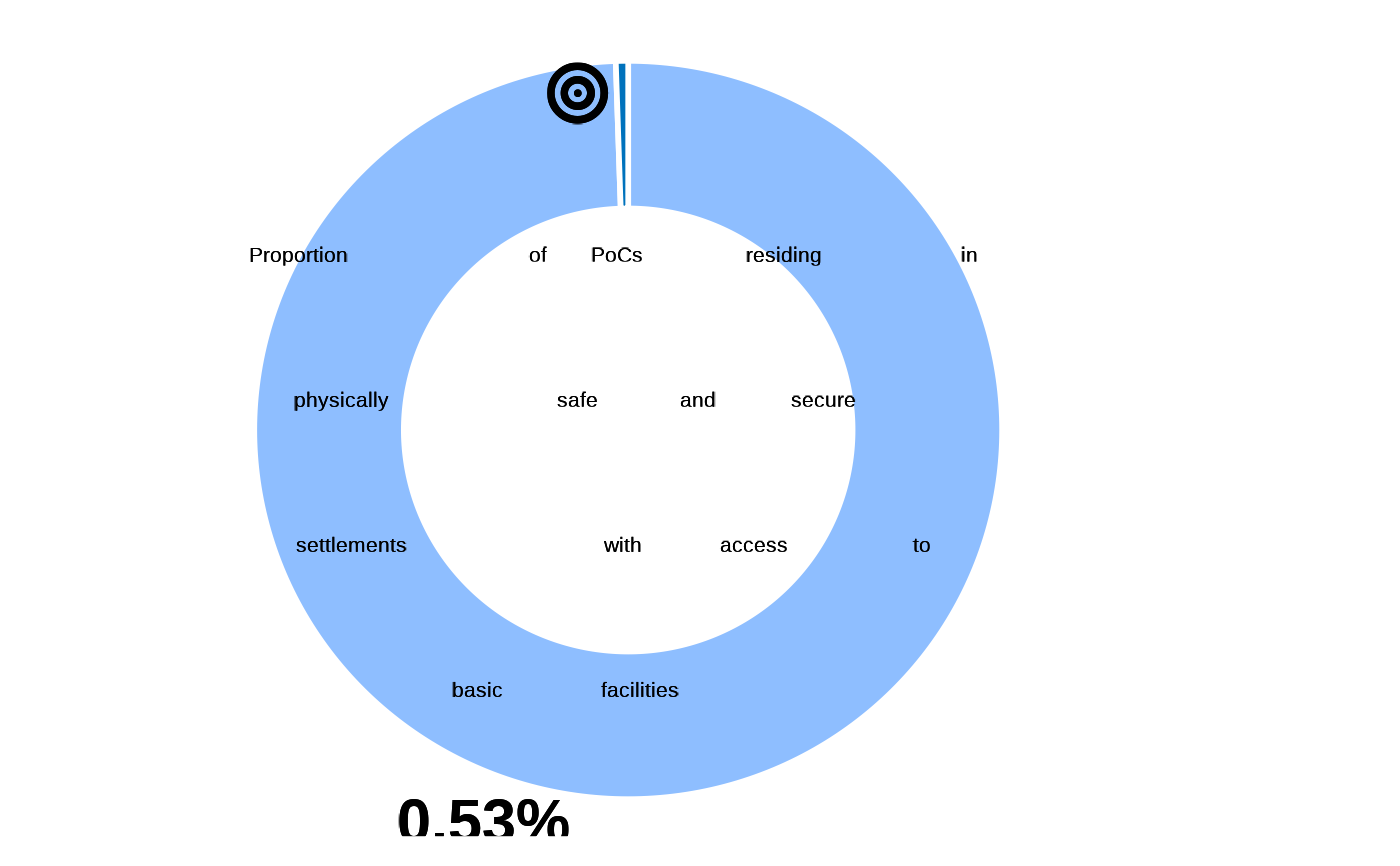
Proportion of Persons of Concern residing in physically safe and secure settlements with access to basic facilities
Arguments
- datalist
A list with all hierarchical data frame for a survey data set. format is expected to match the Excel export synchronized from kobo to RILD and loaded with kobocruncher::kobo_data()
Details
Once electricity, healthcare, drinking water and adequate shelter are calculated, check the values for each variable before, calculating 2.2 impact indicator.
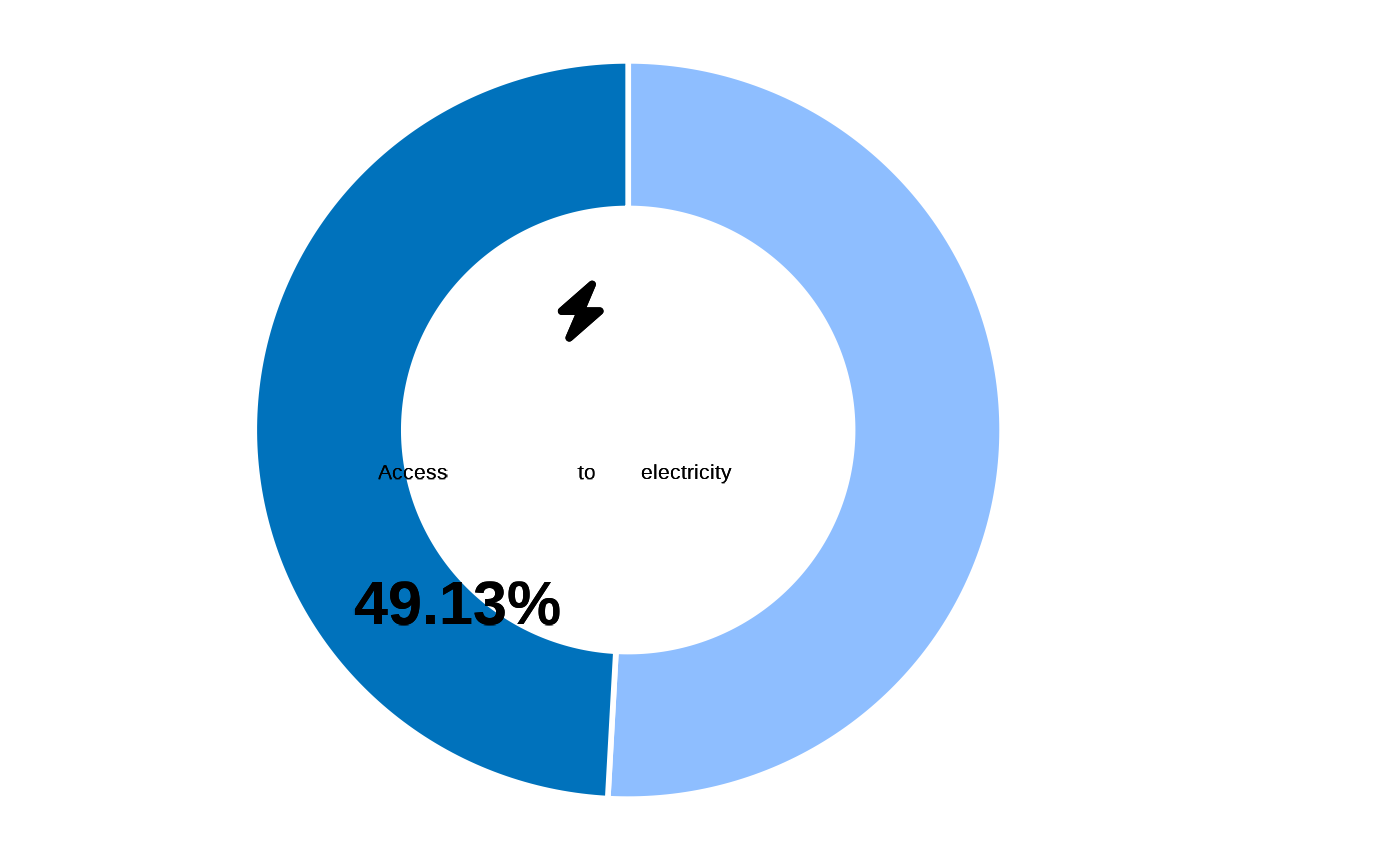
inter_electricity
Households lighting provides a sense of safety and security within and outside the households after sunset.
If households lack access to electricity, especially for lighting and connectivity, this affects the occupants' security and limits their opportunities for socialization, learning and self-reliance.
Numerator: Population with access to electricity, especially for lighting and connectivity
Denominator: Total population
Formula: LIGHT01 = 1 & LIGHT03 != 1, 96, 98
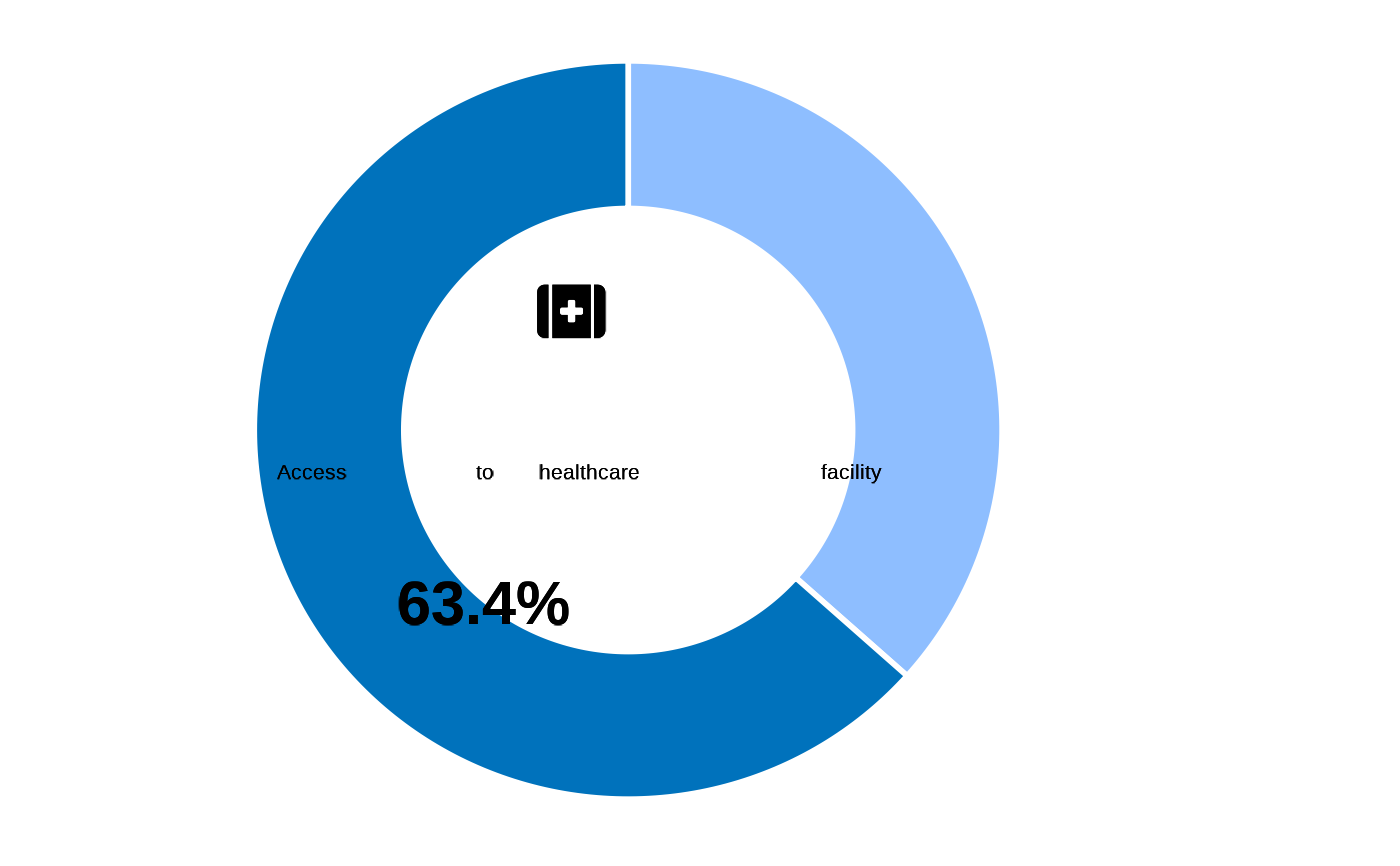
inter_healthcare
Access to healthcare depends on availability of healthcare, including physical reach, acceptability and affordability for all. For this indicator, the focus is on the availability of healthcare system. According to The Sphere Handbook, primary healthcare facility should be accessible within one hour's walk from dwellings. Numerator: Population that can reach a primary healthcare facility within one hour from dwellings Denominator: Total population Formula: HEA01 != 96, 98 & HEA03 <= 60 (reachable within one hour/60 minutes)
inter_drinkingwater
Access to clean drinking water is essential for a person's survival and well being and a precursor for achieving protection outcomes related to health, education and economic developed. The calculation for access drinking water is linked to SGD Indicator 6.1.1. The questionnaire module and the analysis guidance is taken from UNICEF MICS6.
Numerator: Population using improved sources of drinking water either in their dwelling/yard/plot or within 30 minutes round trip collection time
Denominator: Total population
Formula: DWA03 < 30 (under 30 minutes), & DWA01 != 7,9,13,96,98 & DWA02 != 3
This basic service is calculated from the main dataset There are three conditions as below improved source, in dwelling/yard/plot and reachable under 30 minutes
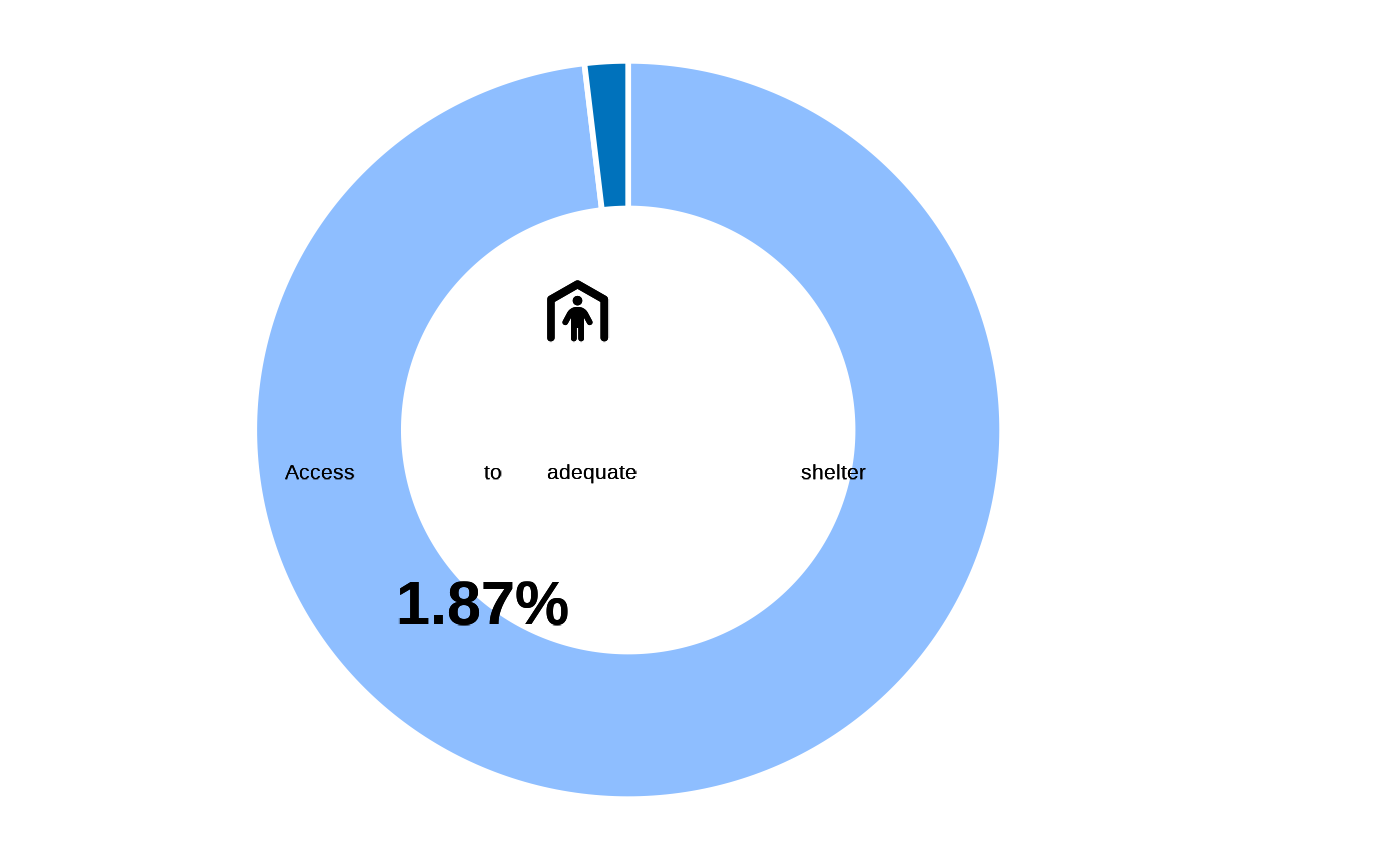
inter_shelter
The right to access adequate housing is protected by international law. The concept of "adequacy" means that housing is more than four walls and a roof as indicated in The Sphere Handbook. Habitable housing primarily refers to the fact that the housing should provide protection from cold, damp, heat, rain, wind, and other threats to health, structural hazards, and disease vectors and it should not be overcrowded. As shelter/housing is primarily a contextual element, there may be discrepancies from country to country on how this data is measured.
Adequate shelter is measured based on having improved material for the dwelling as indicated in DHS publication on housing conditions which is also used by MICS6.
Overcrowding is also used which occurs if there are more than three people per habitable room as defined by UN-Habitat.
Formula:
 *DWE01* = 1,2 &
 *DWE02* = 3,4,5,6,7,8,9 &
 *DWE03* = 8,9,10,11,12,13 &
 *DWE04* = 10,11,12,13,14,15 &
 crowding (*HH01*/*DWE05*) \<= 3
Adequate shelter is calculated from the main dataset classify as habitable when improved/adequate shelter
Compile alll
Once all variables are correctly calculated, we can compute the final variable for impact 2.2 indicator. Numerator: Population residing in physically safe and secure settlements with access to basic facilities Denominator: Total population Formula: shelter=1 & electricity=1 & healthcare=1 & drinkingwater=1
Impact 2.2 is "1" if all services above are accessible
Examples
## data, cf example fct_re_map()
datalist <- kobocruncher::kobo_data( system.file("dummy_RMS_CAPI_v2_mapped.xlsx",
package = "IndicatorCalc"))
#> Warning: Unknown or uninitialised column: `_parent_index`.
## Apply calculation
datalist <- impact_2_2(datalist)
#> ✔ HEA01
#> ✔ HEA02
#> ✔ HEA03
#> ✔ LIGHT01
#> ✔ LIGHT02
#> ✔ LIGHT03
#> ✔ DWA01
#> ✔ DWA02
#> ✔ DWA03a
#> ✔ DWA03b
#> ✔ DWA04
#> ✔ DWE01
#> ✔ DWE02
#> ✔ DWE03
#> ✔ DWE04
#> ✔ DWE05
#> ✔ DWE08
#> ✔ DWE09
#> ✔ HH01
table(datalist[["main"]]$impact2_2, useNA = "ifany")
#>
#> 0 1
#> 1492 8
fct_plot_indic_donut(indicator = datalist[["main"]]$impact2_2,
iconunicode = "f140")
 ## Can get the details as well
table(datalist[["main"]]$electricity, useNA = "ifany")
#>
#> 0 1
#> 763 737
fct_plot_indic_donut(indicator = datalist[["main"]]$electricity,
iconunicode = "f0e7")
## Can get the details as well
table(datalist[["main"]]$electricity, useNA = "ifany")
#>
#> 0 1
#> 763 737
fct_plot_indic_donut(indicator = datalist[["main"]]$electricity,
iconunicode = "f0e7")
 table(datalist[["main"]]$healthcare, useNA = "ifany")
#>
#> 0 1
#> 549 951
fct_plot_indic_donut(indicator = datalist[["main"]]$healthcare,
iconunicode = "f479")
table(datalist[["main"]]$healthcare, useNA = "ifany")
#>
#> 0 1
#> 549 951
fct_plot_indic_donut(indicator = datalist[["main"]]$healthcare,
iconunicode = "f479")
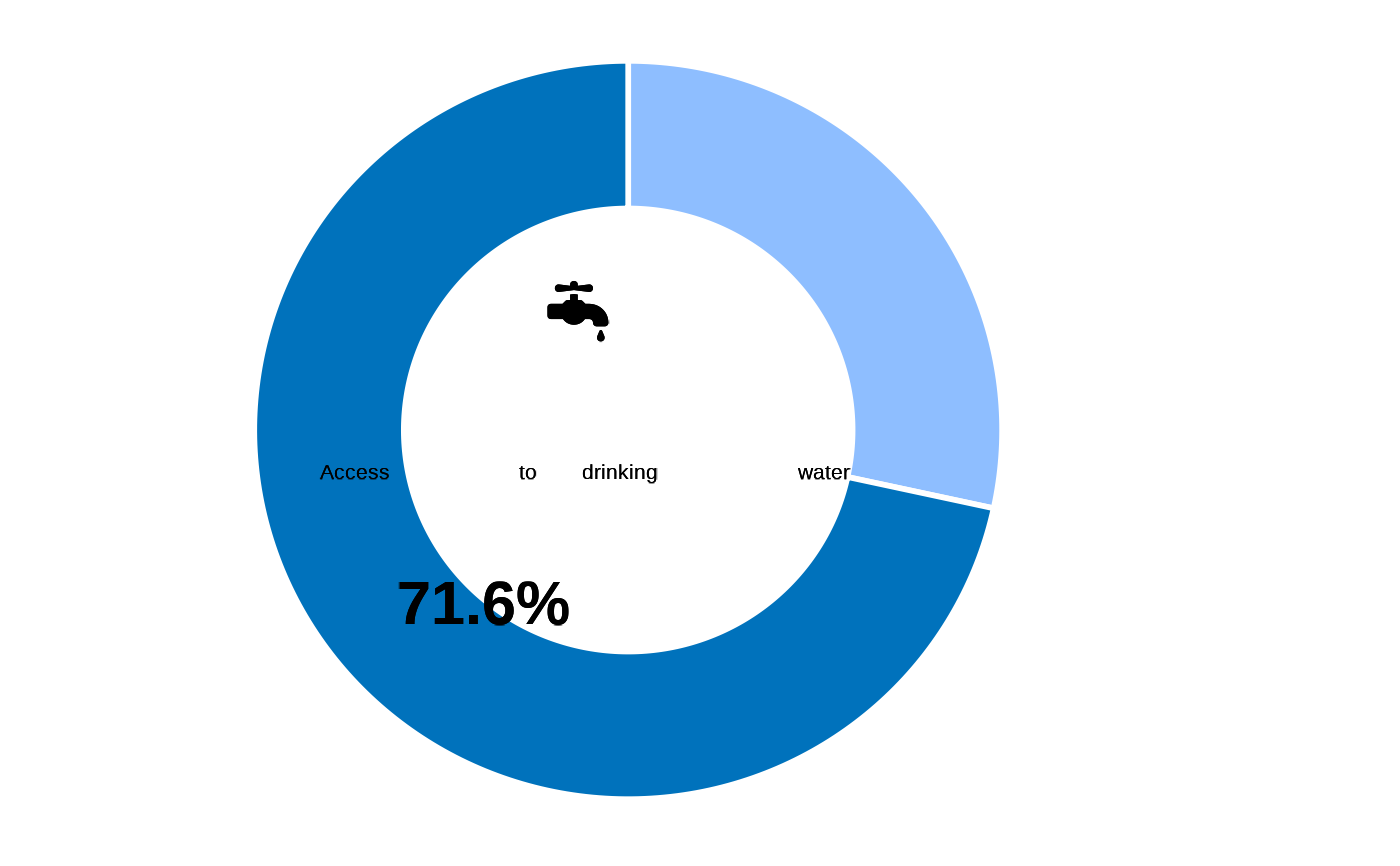
 table(datalist[["main"]]$drinkingwater, useNA = "ifany")
#>
#> 0 1
#> 426 1074
fct_plot_indic_donut(indicator = datalist[["main"]]$drinkingwater,
iconunicode = "e006")
table(datalist[["main"]]$drinkingwater, useNA = "ifany")
#>
#> 0 1
#> 426 1074
fct_plot_indic_donut(indicator = datalist[["main"]]$drinkingwater,
iconunicode = "e006")
 ## Check intermediary variables
table(datalist[["main"]]$dwa_cond1, useNA = "ifany")
#>
#> 1
#> 1500
table(datalist[["main"]]$reachableU30, useNA = "ifany")
#>
#> 0 1
#> 1246 254
table(datalist[["main"]]$DWA02, useNA = "ifany")
#>
#> 1 2 3
#> 497 476 527
table(datalist[["main"]]$dwa_cond2, useNA = "ifany")
#>
#> 0 1
#> 426 1074
# Tabulate
table(datalist[["main"]]$dwe01_cat, useNA = "ifany")
#>
#> 0 1
#> 1212 288
table(datalist[["main"]]$dwe02_cat, useNA = "ifany")
#>
#> 0 1
#> 422 1078
table(datalist[["main"]]$dwe03_cat, useNA = "ifany")
#>
#> 0 1
#> 835 665
table(datalist[["main"]]$dwe04_cat, useNA = "ifany")
#>
#> 0 1
#> 952 548
table(datalist[["main"]]$dwe05_cat, useNA = "ifany")
#>
#> 0 1
#> 258 1242
table(datalist[["main"]]$shelter, useNA = "ifany")
#>
#> 0 1
#> 1472 28
#plot
fct_plot_indic_donut(datalist[["main"]]$shelter,
iconunicode = "e54f")
## Check intermediary variables
table(datalist[["main"]]$dwa_cond1, useNA = "ifany")
#>
#> 1
#> 1500
table(datalist[["main"]]$reachableU30, useNA = "ifany")
#>
#> 0 1
#> 1246 254
table(datalist[["main"]]$DWA02, useNA = "ifany")
#>
#> 1 2 3
#> 497 476 527
table(datalist[["main"]]$dwa_cond2, useNA = "ifany")
#>
#> 0 1
#> 426 1074
# Tabulate
table(datalist[["main"]]$dwe01_cat, useNA = "ifany")
#>
#> 0 1
#> 1212 288
table(datalist[["main"]]$dwe02_cat, useNA = "ifany")
#>
#> 0 1
#> 422 1078
table(datalist[["main"]]$dwe03_cat, useNA = "ifany")
#>
#> 0 1
#> 835 665
table(datalist[["main"]]$dwe04_cat, useNA = "ifany")
#>
#> 0 1
#> 952 548
table(datalist[["main"]]$dwe05_cat, useNA = "ifany")
#>
#> 0 1
#> 258 1242
table(datalist[["main"]]$shelter, useNA = "ifany")
#>
#> 0 1
#> 1472 28
#plot
fct_plot_indic_donut(datalist[["main"]]$shelter,
iconunicode = "e54f")