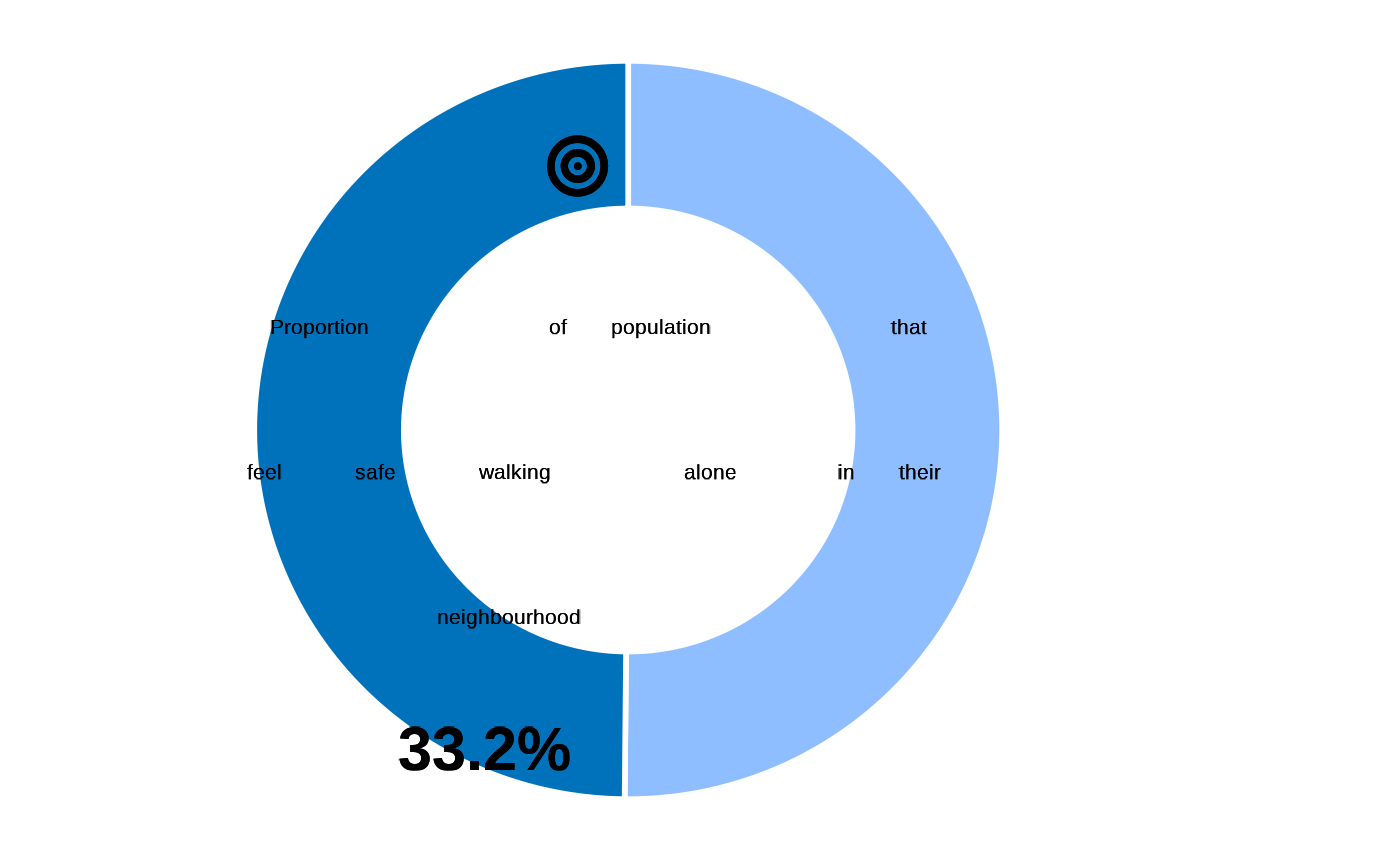
Proportion of population that feel safe walking alone in their neighbourhood
Arguments
- datalist
A list with all hierarchical data frame for a survey data set. format is expected to match the Excel export synchronized from kobo to RILD and loaded with kobocruncher::kobo_data()
Details
This indicator measures the proportion of persons of concern who self-report feeling safe while walking alone in her/his neighborhood after dark. It is linked to SDG indicator 16.1.4.
The standard module for this indicator is taken from SGD indicator owner UNODC. This indicator only pertains to self-reported feeling of 'safety' and not 'security' since security is associated with additional external factors.
| Standard Questions |
| SAF01 |
Numerator: Population who self-report feeling safe walking alone in their neighborhood after dark
Denominator: Total population Formula: SAF01=1,2 / SAF01=1,2,3,4
This indicator comes from main dataset based on the respondent randomly selected for individual level
if unsafe or very unsafe 0, 98 and 99 go into blank I never walk alone will also go into blank if any
Examples
## data, cf example  fct_re_map()
datalist <- kobocruncher::kobo_data( system.file("dummy_RMS_CAPI_v2_mapped.xlsx",
                                                 package = "IndicatorCalc"))
#> Warning: Unknown or uninitialised column: `_parent_index`.
## Apply calculation
datalist <- impact3_3(datalist)
#> ✔ SAF01

## Visualise value
fct_plot_indic_donut(indicator = datalist[["main"]]$impact3_3,
                     iconunicode = "f140")