The function is designed to help the interpretation of survey results by providing a comparison guidelines. It displays a chart to have a base of comparison when analyzing the results of UNHCR of UNHCR Result monitoring survey. It pulls the values published within the UN Registry of SDG Indicator values The function includes a mapping table between RBM/RMS and SDG and extract the data from https://unstats.un.org/SDGAPI/swagger/ using the package SDGsR https://drmattg.github.io/SDGsR/articles/Introduction_to_SDGsR.html devtools::install_github("DrMattG/SDGsR", dependencies = TRUE)
Usage
fct_plot_rbm_sdg(country = "BRA", rbm = "outcome16_2", years = c(2000, 2022))Arguments
- country
iso3 code for the country (easier to recall than the M49 used in the API)
- rbm
the RBM variable name - that can match SDG
- years
years to filter the chart - for instance c(2000,2022)
Examples
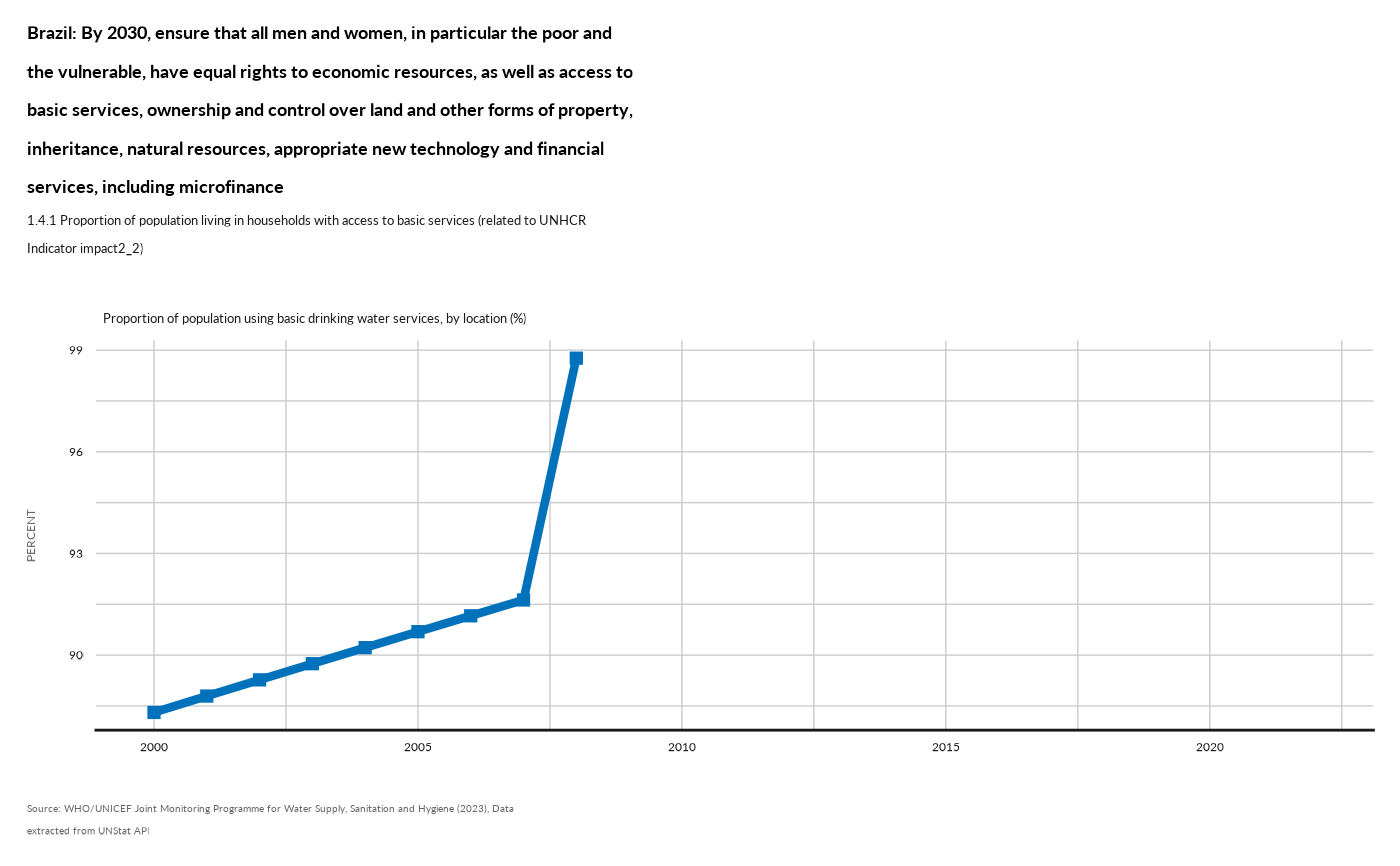
fct_plot_rbm_sdg( country = "BRA",
          rbm = "impact2_2",
          years = c(2000, 2022)) +
        unhcrthemes::theme_unhcr(font_size = 10)
#> Loading required package: ggplot2
#> Loading required package: dplyr
#>
#> Attaching package: ‘dplyr’
#> The following objects are masked from ‘package:stats’:
#>
#>     filter, lag
#> The following objects are masked from ‘package:base’:
#>
#>     intersect, setdiff, setequal, union