4 Potential approaches to calibrate scores
4.1 Vulnerability as a latent variable
Vulnerability is not observed, it’s a latent variable, an intellectual construction based on multiple criteria.
The challenge is:
- Define the criteria
- Provide a measurement for each criteria
- Define relative weights to be used for each criteria
4.2 Avoid compensability effects
Vulnerability scores are composite measurement (cf. Handbook on Constructing Composite Indicators: Methodology and User Guide, OECD/JRC 2008) obtained through combination of aggregated and weighted indicators. Due to the very nature of vulnerability, the sub-vulnerability indicators are unlikely to be fully substituable, i.e. one indicator is unlikely to fully compensate another one. For vulnerability scoring, weights are rather expected to refect the importance of each indicator. Therefore, it is advised to multiply (geometric mean), rather to sum (arithmetic mean) each indicator in order to reflect indicators imperfect substitutability.
The validation of an assistance targeting system could be performed through a detailed analysis of exclusion/exclusion errors between each of the vulnerability scoring approaches.

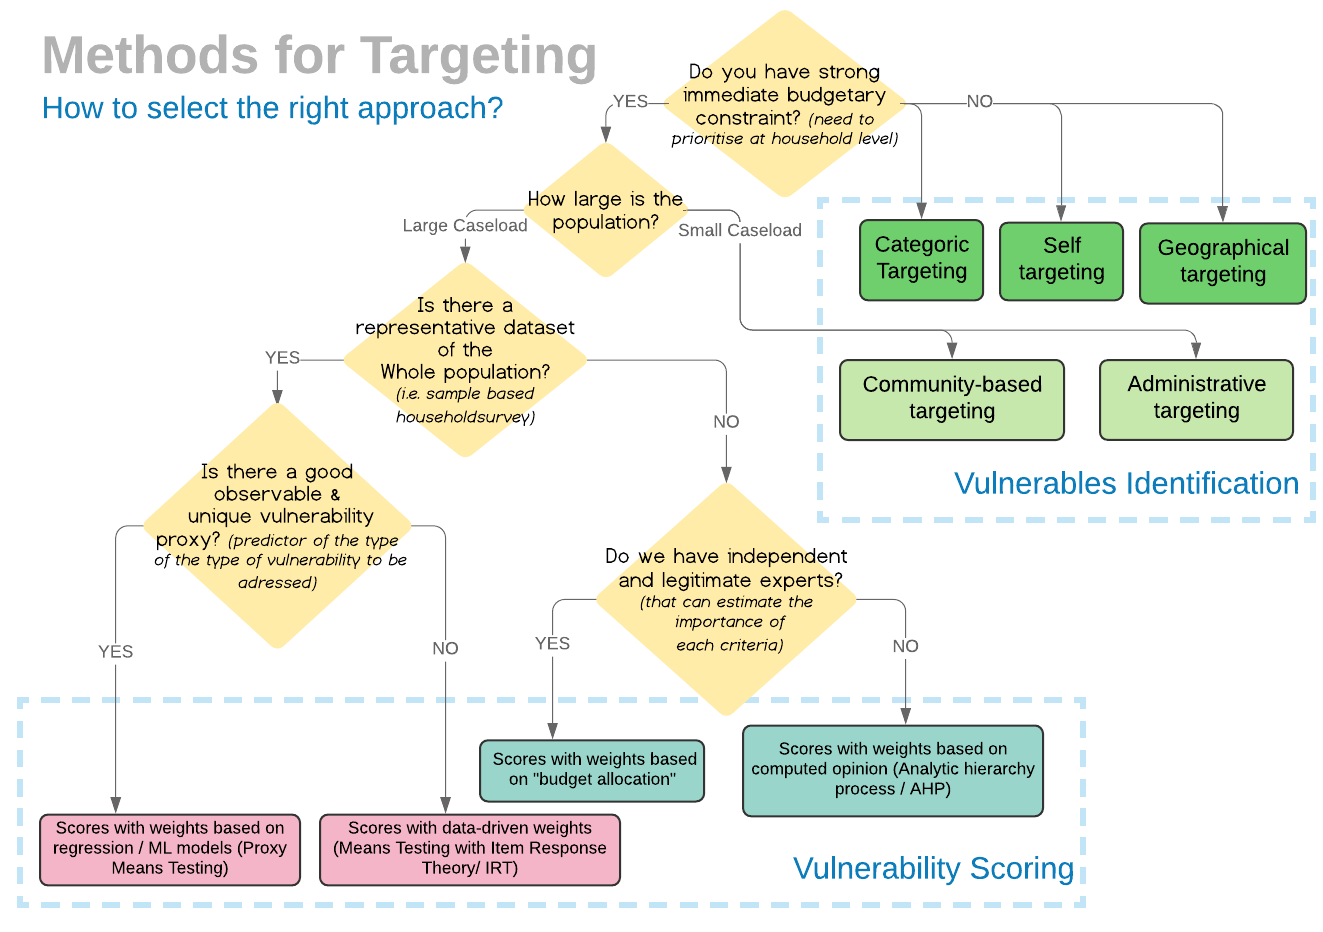
Diagram: Summary of potential targeting approaches
4.3 What data can be used?
Subjective scoring relies on the input of experts to produce a qualitative judgment. Statistical scoring, on the other hand, relies on quantified characteristics of the prospect’s portfolio history recorded in a database. It uses a set of rules and statistical techniques to forecast risk as a probability.
TABLE 1. Comparison of Subjective and Statistical Scoring Dimension Subjective Scoring Statistical Scoring Source of knowledge Experience of loan officer and organization Quantified portfolio history in database Consistency of processVaries by loan officer and day-to-day Identical loans scored identically Explicitness of processEvaluation guidelines in office; sixth sense/gut feeling by loan officers in fieldMathematical rules or formulae relate quantified characteristics to riskProcess and productQualitative classification as loan officer gets to know each client as an individualQuantitative probability as scorecard relates quantitative characteristics to riskEase of acceptanceAlready used, known to work well; MIS and evaluation process already in placeCultural change, not yet known to work well; changes MIS and evaluation processProcess of implementationLengthy training and apprenticeships for loan officersLengthy training and follow-up for all stakeholdersVulnerability to abusePersonal prejudices, daily moods, or simple human mistakesCooked data, not used, underused, or overusedFlexibilityWide application, as adjusted by intelligent managersSingle application, forecasting new type of risk in new context requires new scorecardKnowledge of trade-offs and “what would have happened”Based on experience or assumedDerived from tests with repaid loans used to construct scorecard
Statistical scoring models are:• Empirical. Based on a rigorous statistical analysis that derives empirical ways to distinguish between more and less creditworthy consumers using data from applicants within a reasonable preceding period.• Statistically valid. Developed and validated based on generally accepted statistical practices and methodologies.5BENEfItS of crEdIt ScorINg• Periodically revalidated. Re-evaluated for statistical soundness from time to time and adjusted, as necessary, to maintain or increase its predictive power.
4.3.1 Calibration using expert opinions
First option, weighting sources can be personal views of experts, societal views estimated through surveys or public opinion polls.
4.3.2 Calibration using statistically representative dataset
it’s possible to define a proxy indicator for vulnerability (for instance expenditure per capita as used in the Proxy Means Testing, but also Population Group based on a population segmentation exercise) and from there use regression and other predictive models to get a formula. The main limitation from this approach consists in the assumptions behind the quality of the proxy: for instance, an household can have a good income precisely because children in the household are working. The second limitation for this approach are that weight calculated from within the data (i.e based on respondent) as a function of the data-set, meaning the resulting scores are highly dependent on the representativeness of the respondent….
there are other non-subjective weighting schemes (i.e. task of assigning weights), based on data-driven approaches that do not depend on value judgments or proxies while allowing for analytically sound and transparent process. Though most data-driven techniques such as Principal Component Analysis (PCA), Factor Analysis, Structural Equation Model or Benefit-of-the-Doubt, assumes the observed variables to be continuous even when they are in fact binary or categorical, as this is the case in most household survey questionnaire (cf. On Construction of Robust Composite Indices by Linear Aggregation, Mishra, 2008).